

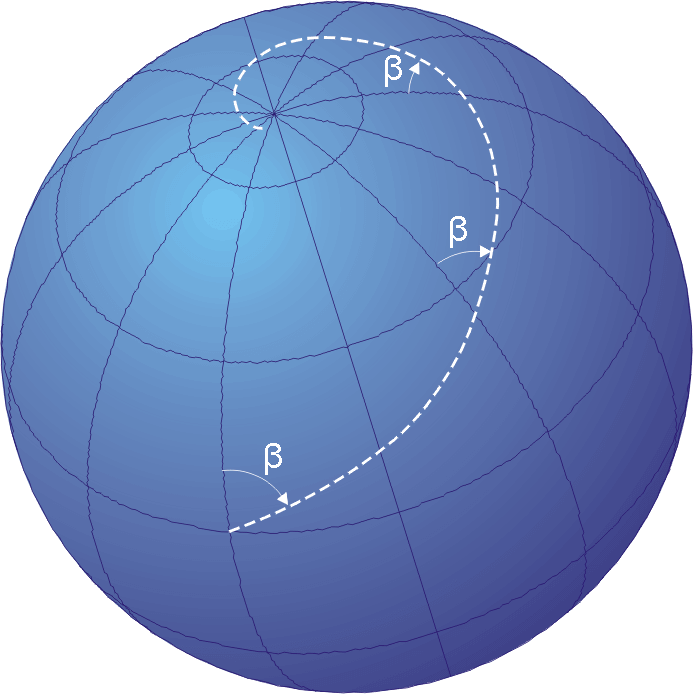

The Mercator projection is a cylindrical map projection created by the Flemish cartographer Gerardus Mercator in 1569. It was originally designed for nautical navigation, which is why it became so widely used. The key feature of the Mercator projection is that it preserves angles, meaning that lines of constant course, or rhumb lines, are straight segments that intersect at a constant angle with the meridians. This property makes it ideal for sailors, as they can plot a straight course on the map and maintain that bearing on their compass.
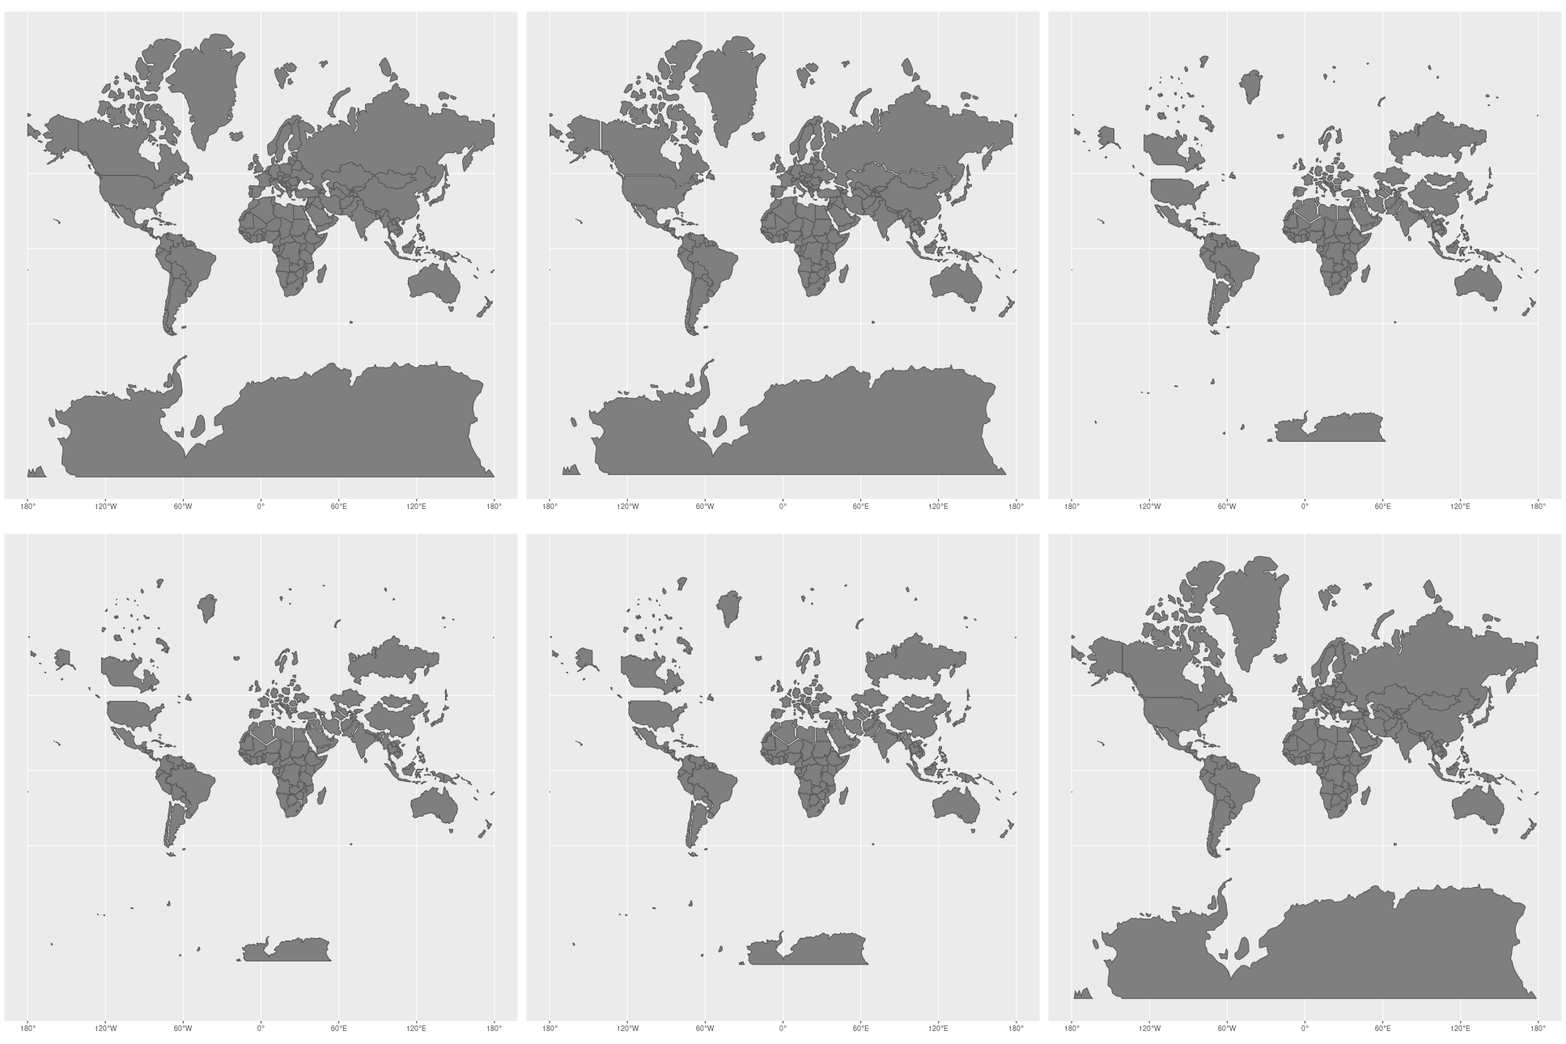

However, the Mercator projection also introduces significant distortions, particularly in the size of objects as the latitude increases from the equator to the poles. Areas near the poles are greatly exaggerated in size compared to their actual dimensions. For example, Greenland appears to be roughly the same size as Africa on a Mercator projection, when in reality, Africa is about 14 times larger. This distortion has led to criticism and debate about the use of the Mercator projection in educational and general-purpose maps, where it can give a misleading impression of the relative sizes of different countries and continents.
Despite its distortions, the Mercator projection has been widely used for centuries and remains familiar to many people due to its historical significance and continued use in some contexts, such as online mapping services. However, for more accurate representations of global geography, other projections like the Robinson, Winkel Tripel, or Gall-Peters projections are often preferred.
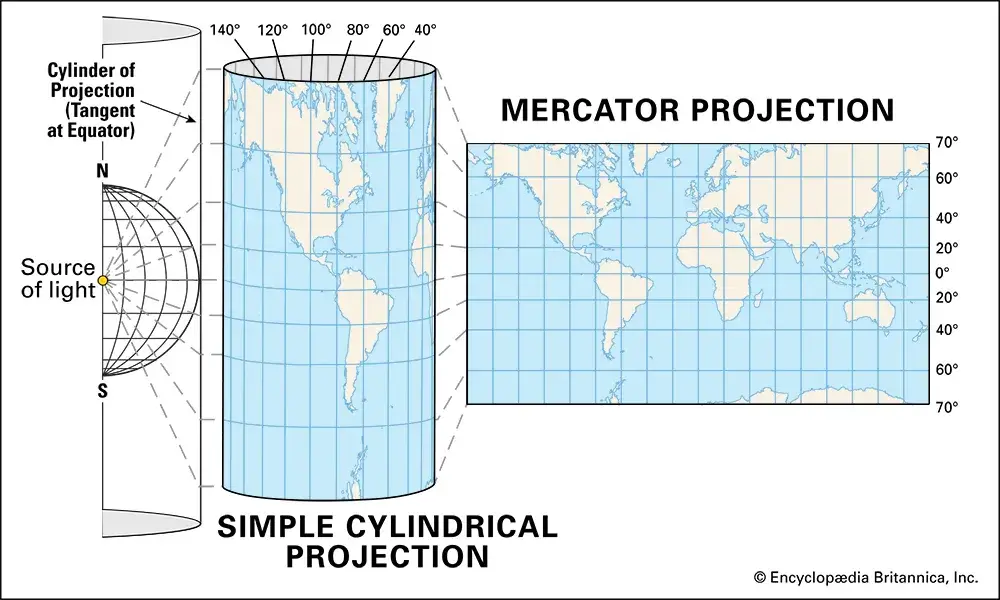
Features of the Mercator Projection:
- Cylindrical Projection: Imagine wrapping a cylinder around the globe. The Mercator projection maps the surface of the Earth onto this cylinder.
- Straight Rhumb Lines: Lines of constant compass bearing are straight, making it easier for navigators to plot a course.
- Distortion: The scale of the map increases with latitude, meaning areas far from the equator appear much larger than they are in reality. For example, Greenland appears much larger than it actually is compared to continents like Africa.
- Equidistant Meridians: The meridians (lines of longitude) are equally spaced vertical lines.
- Expanding Parallels: The parallels (lines of latitude) are horizontal lines that get farther apart as they move away from the equator.
Mercator Projection
Scale 1 : 250,000,000 | Interval 10°
Mercator’s Projection is a cylindrical conformal projection introduced by Gerardus Mercator in 1569.
Its most important property is that it preserves local angles. Lines of constant compass direction, called rhumb lines or loxodromes, appear as straight lines on the map.
The meridians are straight, parallel and equally spaced vertical lines. The parallels are straight horizontal lines, but their spacing increases progressively toward the poles.
Construct a graticule on Mercator’s Projection extending from 70°N to 70°S and 180°W to 180°E, at intervals of 10°, on a scale of 1 : 250,000,000.
Understanding the Shape of the Graticule
Before beginning the calculations, it is useful to understand what the completed Mercator graticule will look like.
All meridians are straight vertical lines and remain equally spaced. All parallels are straight horizontal lines.
However, the parallels become progressively farther apart as latitude increases.
Step 1 – Calculate the Reduced Radius of the Earth
Take the mean radius of the Earth as:
Convert this to centimetres:
At a scale of 1 : 250,000,000:
The reduced radius of the Earth is approximately 2.56 cm.
Step 2 – Calculate the Length of the Equator
The length of the equator on the reduced Earth is:
Therefore:
Draw a horizontal line AB approximately 16.08 cm long.
This line represents the equator from 180°W to 180°E.
Step 3 – Calculate the Spacing Between Meridians
The full longitude range is 360°. Since meridians are required every 10°:
Therefore:
Through each point, draw a straight vertical line. These lines represent the meridians.
Step 4 – Calculate the Distance of the Parallels
The key feature of Mercator’s Projection is that the parallels are not equally spaced.
The distance of a parallel from the equator is calculated from:
An equivalent form is:
If common logarithms are used:
Here:
y = distance of the parallel from the equator
R = reduced radius of the Earth
φ = latitude
Step 5 – Example Calculation for 30° North
Let:
Using:
Substitute the values:
Therefore, mark the 30°N parallel approximately 1.41 cm above the equator.
Mark 30°S the same distance below the equator.
Step 6 – Parallel Distances from the Equator
Calculate the remaining parallels in the same way. The following values are suitable for practical construction:
| Latitude | y/R | Distance from Equator |
|---|---|---|
| 10° | 0.1754 | 0.45 cm |
| 20° | 0.3563 | 0.91 cm |
| 30° | 0.5493 | 1.41 cm |
| 40° | 0.7629 | 1.95 cm |
| 50° | 1.0101 | 2.59 cm |
| 60° | 1.3170 | 3.37 cm |
| 70° | 1.7353 | 4.44 cm |
The same measurements are made below the equator for southern latitudes.
Step 7 – Mark the Parallels
On the central meridian, measure the calculated distances upward and downward from the equator.
Mark:
Through each mark, draw a horizontal straight line across the entire width of the projection.
Step 8 – Draw the Complete Meridian Grid
Through each longitude mark previously made on the equator, draw a straight vertical line.
All meridians remain parallel to the central meridian and equally spaced throughout the projection.
Step 9 – Label and Finish the Projection
The completed map should now show the characteristic Mercator graticule.
- Darken the outer boundary of the graticule.
- Keep the equator slightly more prominent than the other parallels.
- Keep the central meridian slightly more prominent than the other meridians.
- Label latitudes from 70°N to 70°S at 10° intervals.
- Label longitudes from 180°W to 180°E at 10° intervals.
- Write the title: Mercator’s Projection.
- Mention the scale: 1 : 250,000,000.
Why the Parallels Become Farther Apart
Mercator’s Projection is conformal, which means that local angles and shapes are preserved.
As latitude increases, the east-west scale increases by the factor:
To maintain the same scale in the north-south direction, the spacing between parallels must increase by the same amount.
This is why parallels become progressively farther apart toward the poles.
At 90° latitude, the required distance becomes infinite. Therefore, the North and South Poles cannot be shown on a standard Mercator map.
Main Characteristics of Mercator’s Projection
| Property | Mercator Projection |
|---|---|
| Type | Cylindrical conformal projection |
| Meridians | Straight, vertical, parallel and equally spaced |
| Parallels | Straight horizontal lines with increasing spacing |
| Equator | Straight horizontal line |
| Angles | Preserved locally |
| Rhumb Lines | Appear as straight lines |
| Area | Increasingly distorted toward high latitudes |
| Poles | Cannot be represented because their distance is infinite |
Construction Sequence at a Glance
- Calculate the reduced radius of the Earth.
- Calculate the length of the equator.
- Draw the equator from 180°W to 180°E.
- Divide the equator into 10° longitude intervals.
- Draw straight, equally spaced vertical meridians.
- Calculate the distance of each parallel from the equator.
- Mark the parallels north and south of the equator.
- Draw straight horizontal parallel lines.
- Label all latitudes and longitudes.
- Add the title and scale.
Mercator Latitude Distance Calculator
Calculate the distance of any parallel from the equator using: