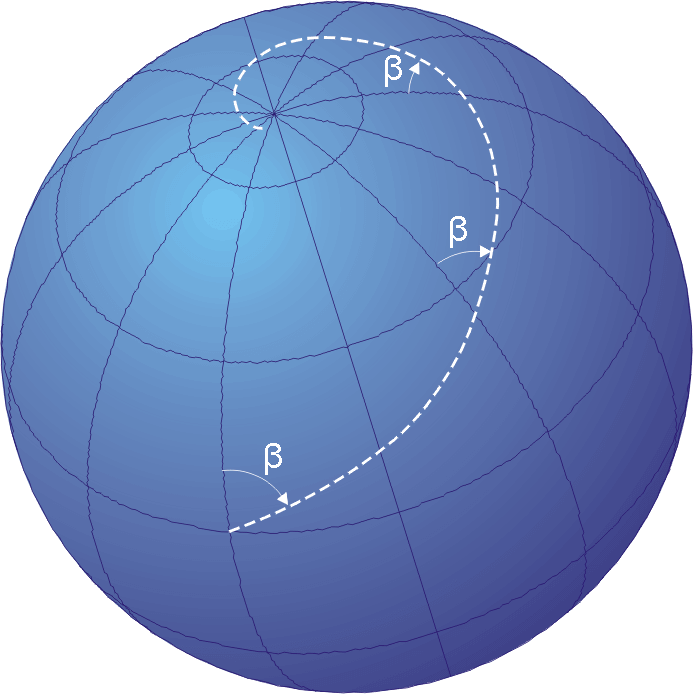
The Mercator projection is a cylindrical map projection created by the Flemish cartographer Gerardus Mercator in 1569. It was originally designed for nautical navigation, which is why it became so widely used. The key feature of the Mercator projection is that it preserves angles, meaning that lines of constant course, or rhumb lines, are straight segments that intersect at a constant angle with the meridians. This property makes it ideal for sailors, as they can plot a straight course on the map and maintain that bearing on their compass.

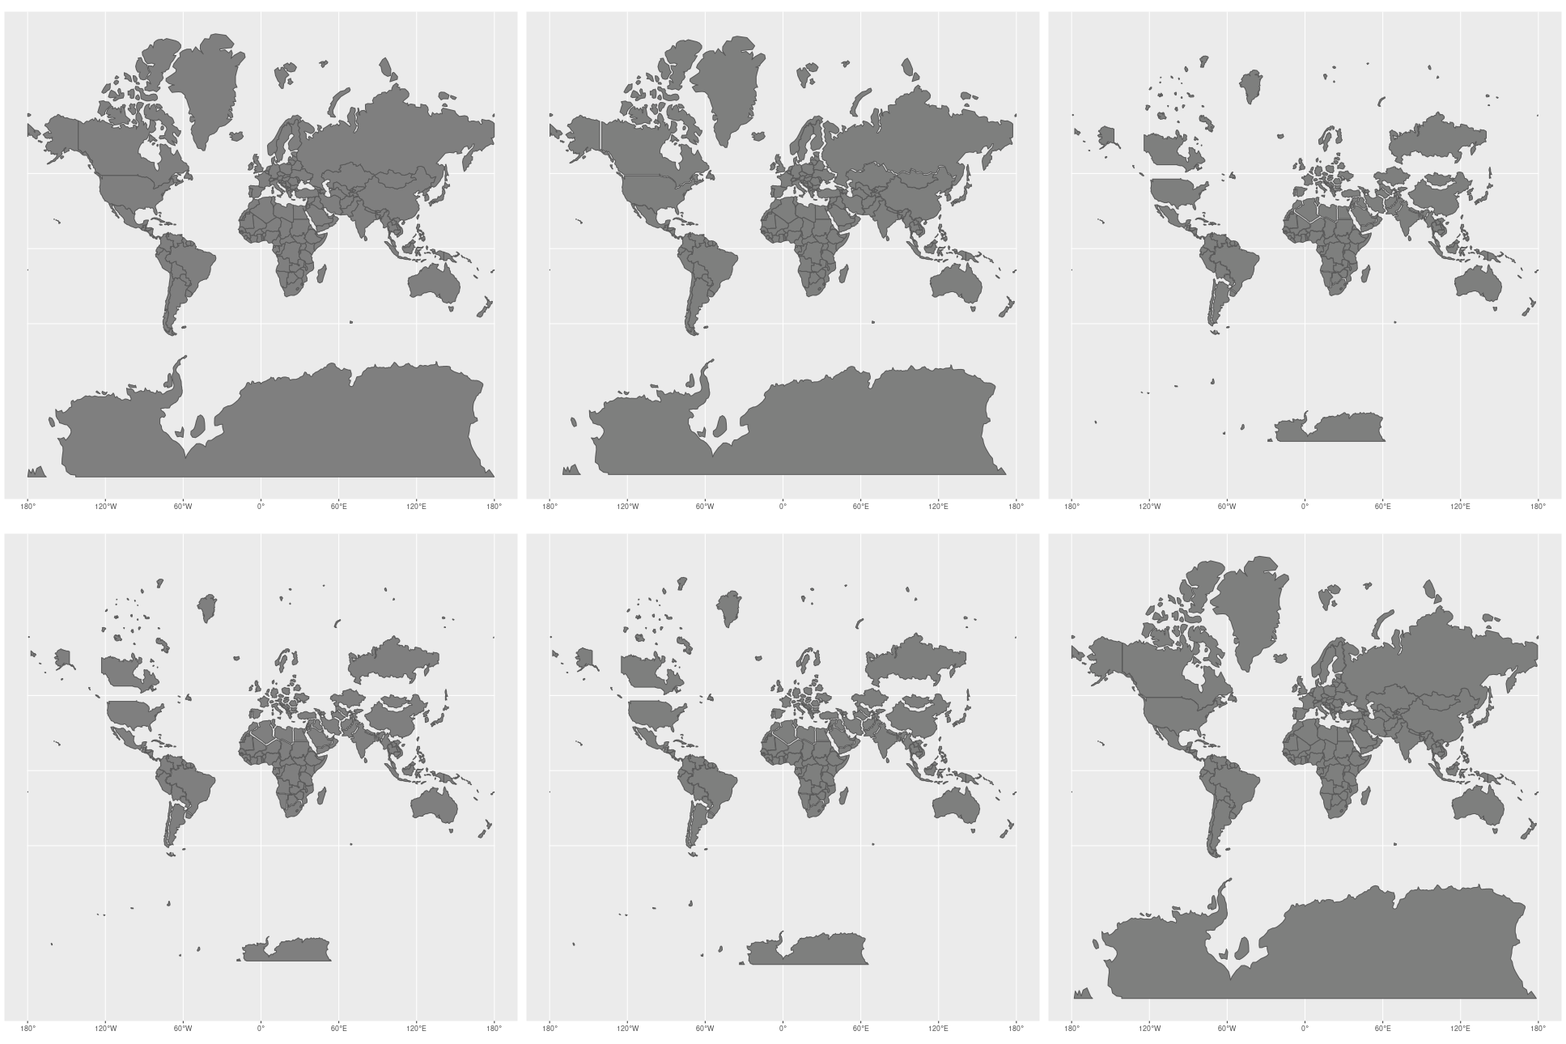
However, the Mercator projection also introduces significant distortions, particularly in the size of objects as the latitude increases from the equator to the poles. Areas near the poles are greatly exaggerated in size compared to their actual dimensions. For example, Greenland appears to be roughly the same size as Africa on a Mercator projection, when in reality, Africa is about 14 times larger. This distortion has led to criticism and debate about the use of the Mercator projection in educational and general-purpose maps, where it can give a misleading impression of the relative sizes of different countries and continents.
Despite its distortions, the Mercator projection has been widely used for centuries and remains familiar to many people due to its historical significance and continued use in some contexts, such as online mapping services. However, for more accurate representations of global geography, other projections like the Robinson, Winkel Tripel, or Gall-Peters projections are often preferred.
Features of the Mercator Projection:
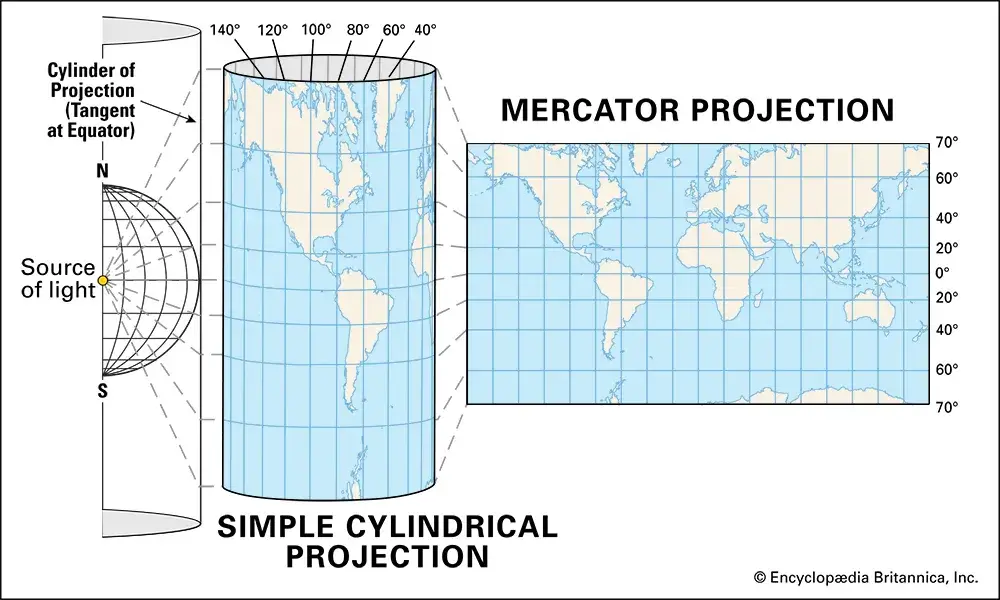
- Cylindrical Projection: Imagine wrapping a cylinder around the globe. The Mercator projection maps the surface of the Earth onto this cylinder.
- Straight Rhumb Lines: Lines of constant compass bearing are straight, making it easier for navigators to plot a course.
- Distortion: The scale of the map increases with latitude, meaning areas far from the equator appear much larger than they are in reality. For example, Greenland appears much larger than it actually is compared to continents like Africa.
- Equidistant Meridians: The meridians (lines of longitude) are equally spaced vertical lines.
- Expanding Parallels: The parallels (lines of latitude) are horizontal lines that get farther apart as they move away from the equator.

Construction of Mercator’s Projection
Construction of Mercator’s Projection
Principles
The construction of Mercator’s projection is relatively straightforward, but it involves the use of calculus to calculate the distances of parallels (lines of latitude) from the equator. The scale of the projection increases with the secant of latitude (sec φ), which leads to the characteristic distortion near the poles.
Let:
- x be the scale.
- φ be the latitude.
- R be the radius of the reduced Earth (a theoretical sphere representing Earth).
The scale x is defined as the ratio of the length of a parallel on the projection to its true length:
$$x = \frac{\text{Length of parallel on projection}}{\text{True length}} = \frac{2R}{2πR \cdot \cos \varphi} = \frac{1}{\cos \varphi} = \sec \varphi$$
Now, let y represent the distance of any parallel (φ) from the equator.
Using a differential equation, we have:
$$\frac{dy}{R} = \sec \varphi \cdot d\varphi$$
By integrating this, we obtain:
$$y = R \log_e (\sec \varphi + \tan \varphi)$$
This equation provides the distance of any parallel from the equator. For practical purposes, the values of y can be calculated for different latitudes (φ). For example, the table below shows the distances of parallels from the equator in terms of R (radius of the reduced Earth):
| Latitude (φ) | Distance from Equator (y) |
|---|---|
| 10° | 0.1754 R |
| 20° | 0.3563 R |
| 30° | 0.5493 R |
| 40° | 0.7629 R |
| 50° | 1.0101 R |
| 60° | 1.3170 R |
| 70° | 1.7353 R |
| 80° | 2.4363 R |
| 90° | ∞ |
As the latitude approaches 90° (the poles), the distance becomes infinite, reflecting the severe distortion at the poles.
Drawing the Projection
The following steps outline the construction of Mercator’s projection:
- Calculate the Radius of the Reduced Earth (R): Determine the radius based on the size of the map or model being created.
- Draw the Equator and Central Meridian: Draw two straight lines intersecting at right angles. The horizontal line represents the equator, and the vertical line represents the central meridian.
- Plot Parallels: Using the equation \( y = R \log_e (\sec \varphi + \tan \varphi) \), calculate and space the parallels (lines of latitude) at varying distances from the equator. The spacing increases as you move towards higher latitudes.
- Plot Meridians: The meridians (lines of longitude) are drawn as vertical straight lines, equally spaced along the equator.
- Label Graticules: Label the lines of latitude and longitude.
- Finalize the Map: Mark the boundary, add a scale at the bottom, and title the projection at the top.
Examples
Question 1: Draw a graticule of Mercator Projection for the world map from 80°N – 80°S and 180°W – 1809E on a 1: 250,000,000 scale at 10° intervals.
Solution:
Reduce the Earth’s Radius Based on the Map Scale: The scale is 1:250,000,000, meaning that 1 inch (or unit) on the map represents 250,000,000 inches (or units) on Earth.
Now, using the map scale of 1:250,000,000 let us find out the radius of the reduced Earth
Radius of Earth in Miles is 3963 (in kilometres 6378)
$$\text{Radius of Reduced Earth} = \frac{3963 \times 63360}{250000000} = \frac{251,327,680}{250,000,000} \approx 1.0053 \text{ inches}$$
This gives a reduced radius (R) of approximately 1 inch.
Length of the Equator
The length of the Earth’s equator is approximately 40,075 km. To find the length of the equator on the map at the given scale, we use the formula:
$$\text{Length of the Equator} = 2 \pi R$$
$$\text{Length of the Equator} = 2 \times 3.1416 \times 1 \, \text{inch} \approx 6.2832 \, \text{inches}$$
Thus, the equator on the map will be about 6.28 inches long.
Interval Between Meridians
At 10° intervals, there will be 36 meridians (360° ÷ 10°). The interval between the meridians along the equator is given by dividing the length of the equator by the number of intervals:
$$\text{Interval between Meridians} = \frac{6.2832 \, \text{inches}}{36} \approx 0.175 \, \text{inches}$$
Thus, each meridian will be spaced 0.175 inches apart along the equator.
Distance Between Parallels (y)
To calculate the distance of the parallels (y) from the equator, we use the following formula based on latitude (φ):
$$y = R \log_e (\sec \varphi + \tan \varphi)$$
$$\text{For } \varphi = 10^\circ,\ R = 1\ \text{inch}:$$
$$y = \log_e(\sec 10^\circ + \tan 10^\circ) = \ln(1.1917) \approx 0.1756\ \text{inches}$$
$$\text{For } \varphi = 20^\circ,\ R = 1\ \text{inch}:$$
$$y = \log_e(\sec 20^\circ + \tan 20^\circ) = \ln(1.4282) \approx 0.3553\ \text{inches}$$
$$\text{For } \varphi = 30^\circ,\ R = 1\ \text{inch}:$$
$$y = \log_e(\sec 30^\circ + \tan 30^\circ) = \ln(1.7321) \approx 0.5493\ \text{inches}$$
For the reduced radius R = 1 inch, we can compute the distances of each parallel. Here’s the corrected table based on the values provided:
| Latitude (φ) | Distance from Equator (y) |
|---|---|
| 10° | 0.18 inches |
| 20° | 0.36 inches |
| 30° | 0.55 inches |
| 40° | 0.76 inches |
| 50° | 1.01 inches |
| 60° | 1.32 inches |
| 70° | 1.74 inches |
| 80° | 2.44 inches |
| 90° | ∞ |
Draw graticule on Mercator’s Projection covering 70°N – 70°S and 180°W – 1809E on a scale of 1:250,000,000 at 10° interval
Question 2: To solve the problem of drawing a graticule of Mercator’s Projection covering 70°N – 70°S and 180°W – 180°E on a scale of 1:250,000,000 at 10° intervals, let’s follow these steps:
Step 1: Radius of the Earth
The radius of the Earth is approximately 6,371 km, which converts to 6,371,000 meters or 637,100,000 cm.
Step 2: Reduced Radius on the Map
Given the scale of 1:250,000,000, we calculate the reduced radius ( R ) on the map as follows:
$$R = \frac{637,100,000 \, \text{cm}}{250,000,000} = 2.5484 \, \text{cm}$$
Thus, the reduced radius ( R ) of the Earth on the map is approximately 2.55 cm.
Step 3: Calculate the Distance of Parallels from the Equator
For Mercator’s projection, the distance of each parallel from the equator is calculated using the formula:
$$y = R \times 2.3026 \log_{10} \left( \tan \left( 45^\circ + \frac{\varphi}{2} \right) \right)$$
Where: \(R = 2.55 \, \text{cm} \) and \( \varphi \) Is the latitude in degrees.
Now, let’s calculate the distances for each 10° interval up to 70°.
Step 4: Distance Calculations for Parallels
| Latitude (φ) | Distance Formula (y) | Distance (y) in cm |
|---|---|---|
| 10° | \( 2.55 \times 2.3026 \log_{10} \left( \tan (45^\circ + 5^\circ) \right) \) | 0.45 cm |
| 20° | \( 2.55 \times 2.3026 \log_{10} \left( \tan (45^\circ + 10^\circ) \right) \) | 0.91 cm |
| 30° | \( 2.55 \times 2.3026 \log_{10} \left( \tan (45^\circ + 15^\circ) \right) \) | 1.41 cm |
| 40° | \( 2.55 \times 2.3026 \log_{10} \left( \tan (45^\circ + 20^\circ) \right) \) | 1.95 cm |
| 50° | \( 2.55 \times 2.3026 \log_{10} \left( \tan (45^\circ + 25^\circ) \right) \) | 2.59 cm |
| 60° | \( 2.55 \times 2.3026 \log_{10} \left( \tan (45^\circ + 30^\circ) \right) \) | 3.37 cm |
| 70° | \( 2.55 \times 2.3026 \log_{10} \left( \tan (45^\circ + 35^\circ) \right) \) | 4.44 cm |
Step 5: Length of the Equator
The circumference of the Earth (length of the equator) is approximately 40,075 km, which converts to 4,007,500,000 cm. On the map with a scale of 1:250,000,000, the length of the equator is:
$$\text{Length of Equator} = \frac{4,007,500,000 \, \text{cm}}{250,000,000} = 16.03 \, \text{cm}$$
Step 6: Spacing of Meridians at 10° Intervals
There are 36 meridians (from 180°W to 180°E) at 10° intervals. The spacing between meridians at the equator is calculated by dividing the length of the equator by 36:
$$\text{Spacing between meridians} = \frac{16.03 \, \text{cm}}{36} = 0.445 \, \text{cm}$$
Thus, the spacing between meridians at the equator is 0.445 cm.
Final Answer:
To draw a graticule on Mercator’s Projection at a 1:250,000,000 scale, covering 70°N to 70°S and 180°W to 180°E at 10° intervals:
- Radius of the Earth (R) on the map: 2.55 cm.
- Length of the equator on the map: 16.03 cm.
- Spacing between meridians at the equator: 0.445 cm.
- Distances of parallels from the equator:
- 10°: 0.45 cm
- 20°: 0.91 cm
- 30°: 1.41 cm
- 40°: 1.95 cm
- 50°: 2.59 cm
- 60°: 3.37 cm
- 70°: 4.44 cm
Latitude Distance Calculator for Mercator Projection
Calculate the distance of a parallel from the equator.
Using the formula:
y = R × ln(sec(φ) + tan(φ))