
What are weather maps?
A weather map serves as a symbolic representation of the atmospheric conditions in a specific area at a given moment. It encompasses isobars and symbols that depict information about pressure, wind direction and velocity, cloud cover, precipitation, and sea conditions. These details are collected from different weather stations at specified intervals.
Meteorological departments utilize these weather elements displayed on a weather map to forecast future weather conditions. These forecasts assist in preparing for and taking necessary safety measures in advance, whether for a day, a week, or even a month. Weather predictions are particularly beneficial for farmers, fishermen, ship crews, and air travel, as they provide insight into the expected atmospheric conditions several hours ahead.
Weather maps amalgamate weather-related data from various meteorological stations specific to the mapped region.

How are weather observations made?
The World Meteorological Organization (WMO), a specialized agency of the United Nations, coordinates meteorological observations at three distinct levels worldwide: surface observatories, upper air observatories, and space-based observation platforms.
Surface observations
A typical surface observatory has instruments for measuring and recording weather elements like temperature (maximum and minimum), air pressure, humidity, clouds, wind and rainfall. Specialised observatories also record elements like radiation, ozone atmospheric trace gases, pollution and atmospheric electricity. These observations are taken all over the globe at fixed times of the day as decided by the WMO and the use of instruments are made conforming to international standards, thus making observations globally compatible. In India, meteorological observations are normally classified into five categories depending upon their instruments and the number of daily observations taken. The highest category is Class-I. Typical instrumental facility available in a Class-I observatory consists of the following:
- Maximum and minimum thermometers
- Anemometer and wind vane
- Dry and Wet bulb thermometer
- Rain gauge
- Barometer Observations
are taken in these observatories normally at 00,03,06,09,12,15,18,21 hours (Greenwich Mean Time) around the globe. However, for logistic reasons, some of the observatories take a limited number of daily observations upper-air observations during the daytime only.
Space observations
Weather satellites play a crucial role in gathering comprehensive and large-scale observations of various meteorological elements both at ground level and in the upper layers of the atmosphere. These space-based observation platforms, particularly the geostationary satellites, offer invaluable insights into current weather conditions.
One notable example is the Indian National Satellite (INSAT), which has been instrumental in providing essential data on temperature, cloud cover, wind patterns, and associated weather phenomena. These observations help meteorologists and scientists gain a better understanding of weather systems, enabling more accurate weather forecasting and analysis of weather-related events.
By continuously monitoring weather patterns and changes from space, weather satellites contribute significantly to our ability to track and respond to various weather conditions and natural disasters in real time. They enhance our capacity to prepare for extreme weather events, assess the impact of climate change, and improve overall weather forecasting capabilities for regions around the world. As technology continues to advance, weather satellites will remain a critical component of our global meteorological monitoring and prediction systems, contributing to better-informed decision-making and the protection of lives and property.
Indian Meteorological Department (IMD)
The Indian Meteorological Department (IMD) is the national meteorological agency of India. It is responsible for providing weather forecasts and warnings, as well as studying and monitoring meteorological phenomena across the country. The IMD (India Meteorological Department) divides the whole country into six zones, with nearly 350 observatories. It plays a crucial role in safeguarding lives and property by issuing timely weather advisories and warnings during severe weather events such as cyclones, heavy rainfall, heatwaves, and cold waves.
Established in 1875, the IMD operates under the Ministry of Earth Sciences of the Government of India. It has a network of weather observatories, radars, satellites, and weather forecasting centers across the country, collecting and analyzing data to generate accurate weather forecasts and disseminate weather information to the public, industries, and various sectors.
Weather charts
The data received from various weather observatories are plenty and detailed. As such, they cannot be incorporated into one single chart unless the coding designed to give the economy of expression is used. These are called synoptic weather charts and the codes used are called meteorological symbols. Weather charts provide the primary tools for weather forecasting. They help in locating and identifying different air masses, pressure systems, fronts and areas of precipitation.
Weather charts are graphical representations of meteorological data that provide a visual overview of various atmospheric conditions and weather elements at a specific time and location. These charts help meteorologists and weather forecasters analyze and understand the current state of the atmosphere and make predictions about future weather patterns.
Types of weather charts
There are several types of weather charts, each presenting different sets of information:
- Surface Weather Charts: These charts display weather elements at the Earth’s surface, such as temperature, air pressure, humidity, wind direction and speed, cloud cover, and precipitation. Isobars, lines connecting points of equal atmospheric pressure, and other symbols are used to illustrate weather patterns, such as high-pressure systems, low-pressure systems, fronts, and weather systems.
- Upper-Air Charts: These charts represent meteorological data collected from weather balloons or satellite sensors at different altitudes in the atmosphere. They typically show temperature, humidity, and wind profiles at various levels above the surface. Upper air charts are crucial for understanding the vertical structure of the atmosphere and identifying jet streams, troughs, and ridges.
- Weather Radar Charts: Radar images provide real-time data on precipitation patterns, intensity, and movement. These charts help track storms, rainfall, and snowfall, which is essential for monitoring severe weather events like thunderstorms and hurricanes.
- Satellite Imagery Charts: Satellite images show cloud cover, weather systems, and atmospheric features from space. These charts offer a global perspective and aid in monitoring large-scale weather patterns, like tropical cyclones, cloud cover, and large storm systems.
Weather charts are indispensable tools for weather forecasting, as they allow meteorologists to visualize and interpret complex weather data. By analyzing these charts, meteorologists can make more accurate predictions and issue weather advisories and warnings, helping communities prepare for and respond to changing weather conditions.
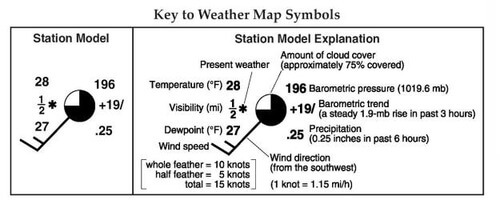
Weather map symbols
Weather symbols are graphical representations used to depict different meteorological conditions and weather elements on weather maps and charts. These symbols serve as a quick and standardized way to convey complex weather information in a simple and easily understandable format.
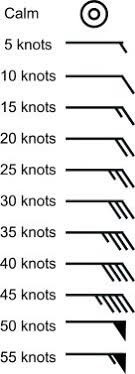
Wind
Wind direction is indicated by a line coming from the centre of the station circle. The line indicates the direction from which the wind is blowing. Wind speed and direction
On the end of the wind direction line are ‘feathers’, these indicate the wind speed. Half feathers represent 5 knots whilst whole feathers indicate 10 knots. A wind speed of 50 knots is indicated by a triangle. Combinations of these can be used to report wind speed to the nearest 5 knots.
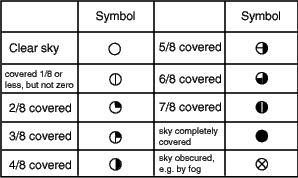
Cloud Cover
Cloud cover is indicated by the shading of the centre of the station circle. The table below shows the meanings of the different symbols.
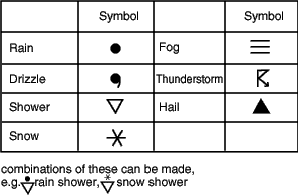
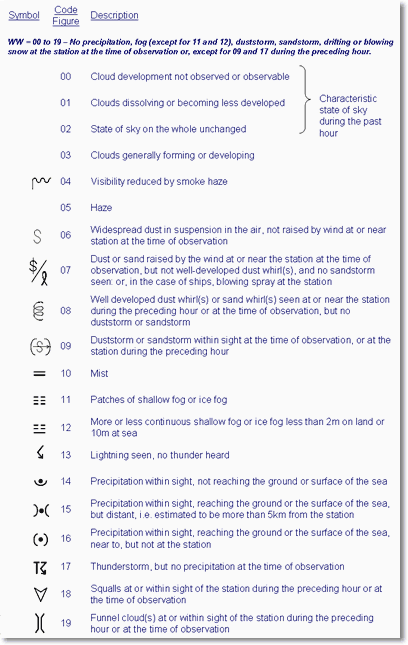
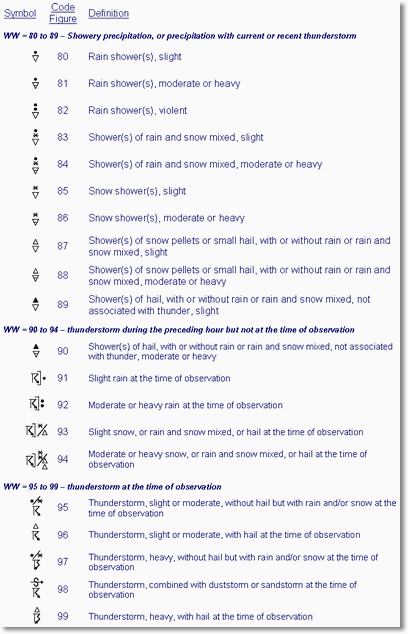
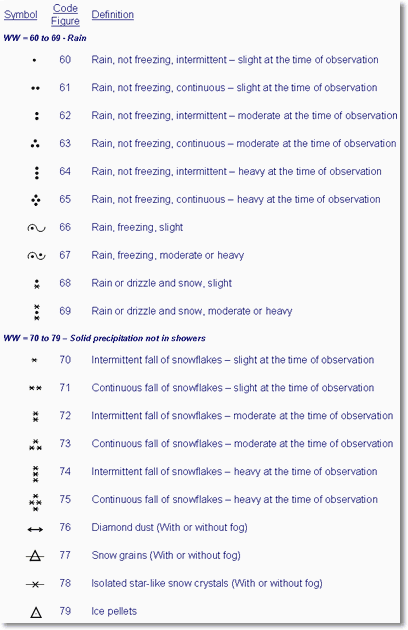
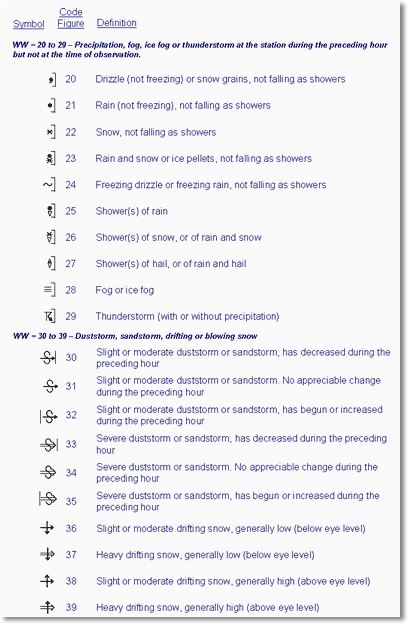
Weather
In total, the Met Office has 99 codes for recording the current weather at the time of the observation. However, these can be simplified. Different types of weather are represented using different weather symbols, a key to which can be found in the adjacent figure.
Full List of weather symbols (Pages 1, 2, 3, 4, 5)

Sea Condition
Sea conditions are shown by abbreviations of descriptive terms expressing the variable character of sea surface ranging from calm (Cm) to Phenomenal (Ph).
Temperature
Temperature is plotted to the nearest degree and is located in the top left-hand of the station plot.
Pressure
Pressure is plotted in the top right-hand corner of the station
Isometric lines or Isopleths
On weather maps, climatic data is often represented using line symbols. The most common type of lines is called isometric lines, which are shown as isopleths. These isopleths help us understand areas with similar average values of temperature, rainfall, pressure, sunshine, clouds, and other factors. Here are some examples of these lines and what they mean:
- Isobars: Lines connecting places with the same air pressure.
- Isotherms: Lines connecting places with the same temperature.
- Isohyets: Lines connecting places with the same amount of rainfall over a specific period of time.
- Isotachs: Lines connecting areas of equal wind speed.
- Isohels: Lines connecting places with the same average daily duration of sunshine.
- Isonephs: Lines connecting places with the same average cloud cover.
By using these isopleths on the map, we can quickly observe and analyze the patterns and variations in climatic conditions across different regions.
Weather map and synoptic chart
Weather maps and synoptic charts are both graphical representations used in meteorology to display weather information. However, they have distinct differences in terms of the type of data they show and their level of detail.
Weather maps
- Weather maps are general maps that display various weather elements, such as temperature, precipitation, wind, and pressure, for a particular region or the entire globe.
- These maps provide a broad overview of weather conditions and patterns.
- Weather maps often use simple symbols, colours, and contour lines to represent weather data.
- They are commonly used in weather forecasts for the general public, showing a snapshot of weather conditions at a specific time or over a specific period.
Synoptic charts
- Synoptic charts, also known as synoptic weather charts or synoptic analyses, are specialized maps that present detailed meteorological data collected from numerous weather stations at specific times.
- These charts focus on a smaller region or a specific weather system, such as a low-pressure area or a cold front.
- Synoptic charts provide more detailed information, including isobars (lines connecting places of equal pressure), isotherms (lines connecting places of equal temperature), and other meteorological features.
- They are primarily used by meteorologists and weather experts to analyze and predict weather patterns, particularly for short to medium-term forecasts.
Weather maps offer a general overview of weather conditions on a larger scale, while synoptic charts provide more detailed and specific information, usually focusing on a particular region or weather system. Both types of graphical representations are essential tools in meteorology, serving different purposes and audiences.
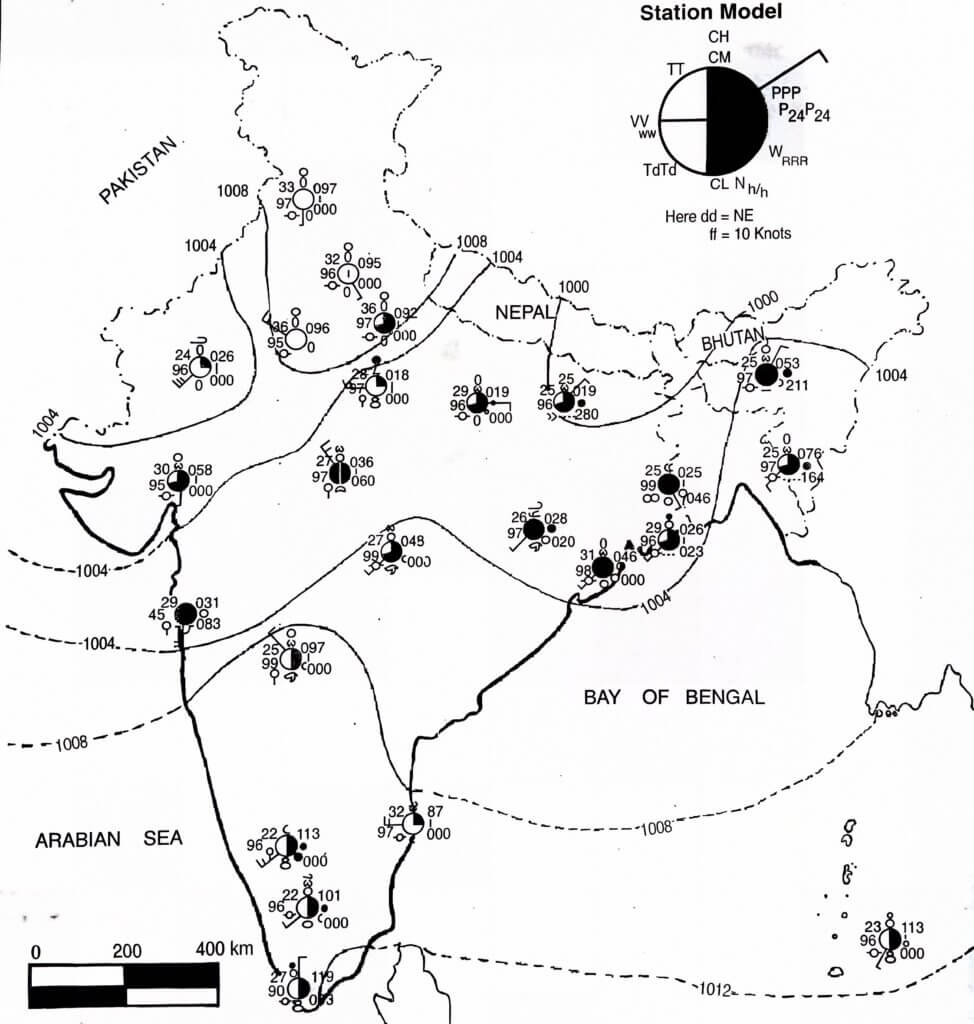
Station model
In meteorology, the station model is a standardized way to represent weather observations from a specific weather station on weather maps and charts. It provides a concise and graphical depiction of various weather elements observed at that location. This visual representation aids meteorologists in quickly interpreting current weather conditions at a glance.
The station model typically consists of several components:
- Temperature: The air temperature is shown in degrees Fahrenheit (°F) or Celsius (°C) near the centre of the station model.
- Air Pressure: Atmospheric pressure is represented by three digits in millibars (mb) and is located to the right of the temperature.
- Wind Direction: Wind direction is indicated by a line extending from the center of the station model. The direction the line points to represents the direction from which the wind is blowing.
- Wind Speed: Wind speed is shown in knots or miles per hour (mph) and is placed near the end of the wind direction line.
- Cloud Cover: Cloud cover is denoted using various symbols around the station model, indicating different cloud types and amounts.
- Dew Point: Dew point temperature, representing the temperature at which the air becomes saturated and dew forms, may also be included in some station models.
- Precipitation: Precipitation observations, such as rain, snow, or drizzle, may be represented with specific symbols near the station model.
- Other Weather Conditions: Additional weather information, such as visibility and significant weather events, can be added using appropriate symbols.
By using the station model, meteorologists can efficiently communicate and analyze weather data from various weather stations on weather maps, contributing to accurate weather forecasting and a better understanding of atmospheric conditions.
Daily weather report of India
Indian daily weather report is prepared twice a day at 8:30 and 17:30 hours by the Indian Metrological Department with its working headquarter at Pune, Maharashtra. The report is based on the information gathered from observations set up all over India. In order to collect metrological information. The zones are named as New Delhi, Chennai, Kolkata, Mumbai, Nagpur and Guwahati. These observatories have been divided into five classes.
First Class Observatories: The first class observatories record data of temperature, pressure, wind velocity, wind directions, humidity and rainfall with the help of self-recording instruments including thermograph, barograph, anemograph and hygrograph. The observatories listed under first class send weather reports twice a day.
Second Class Observatories: They have eye-recording instruments only. These include maximum and minimum thermometers, wet and dry bulb thermometers, barometers, wind-vane anemometers and rain gauges. They also send weather reports twice a day.
Third-Class Observatories: They have all those eye-recording instruments which are found in second-class observatories. The only difference is that they send weather reports only once a day.
Fifth Class Observations: They send information about the amount of rainfall recorded during the last 24 hours. This information is being sent every day at 8 hours.
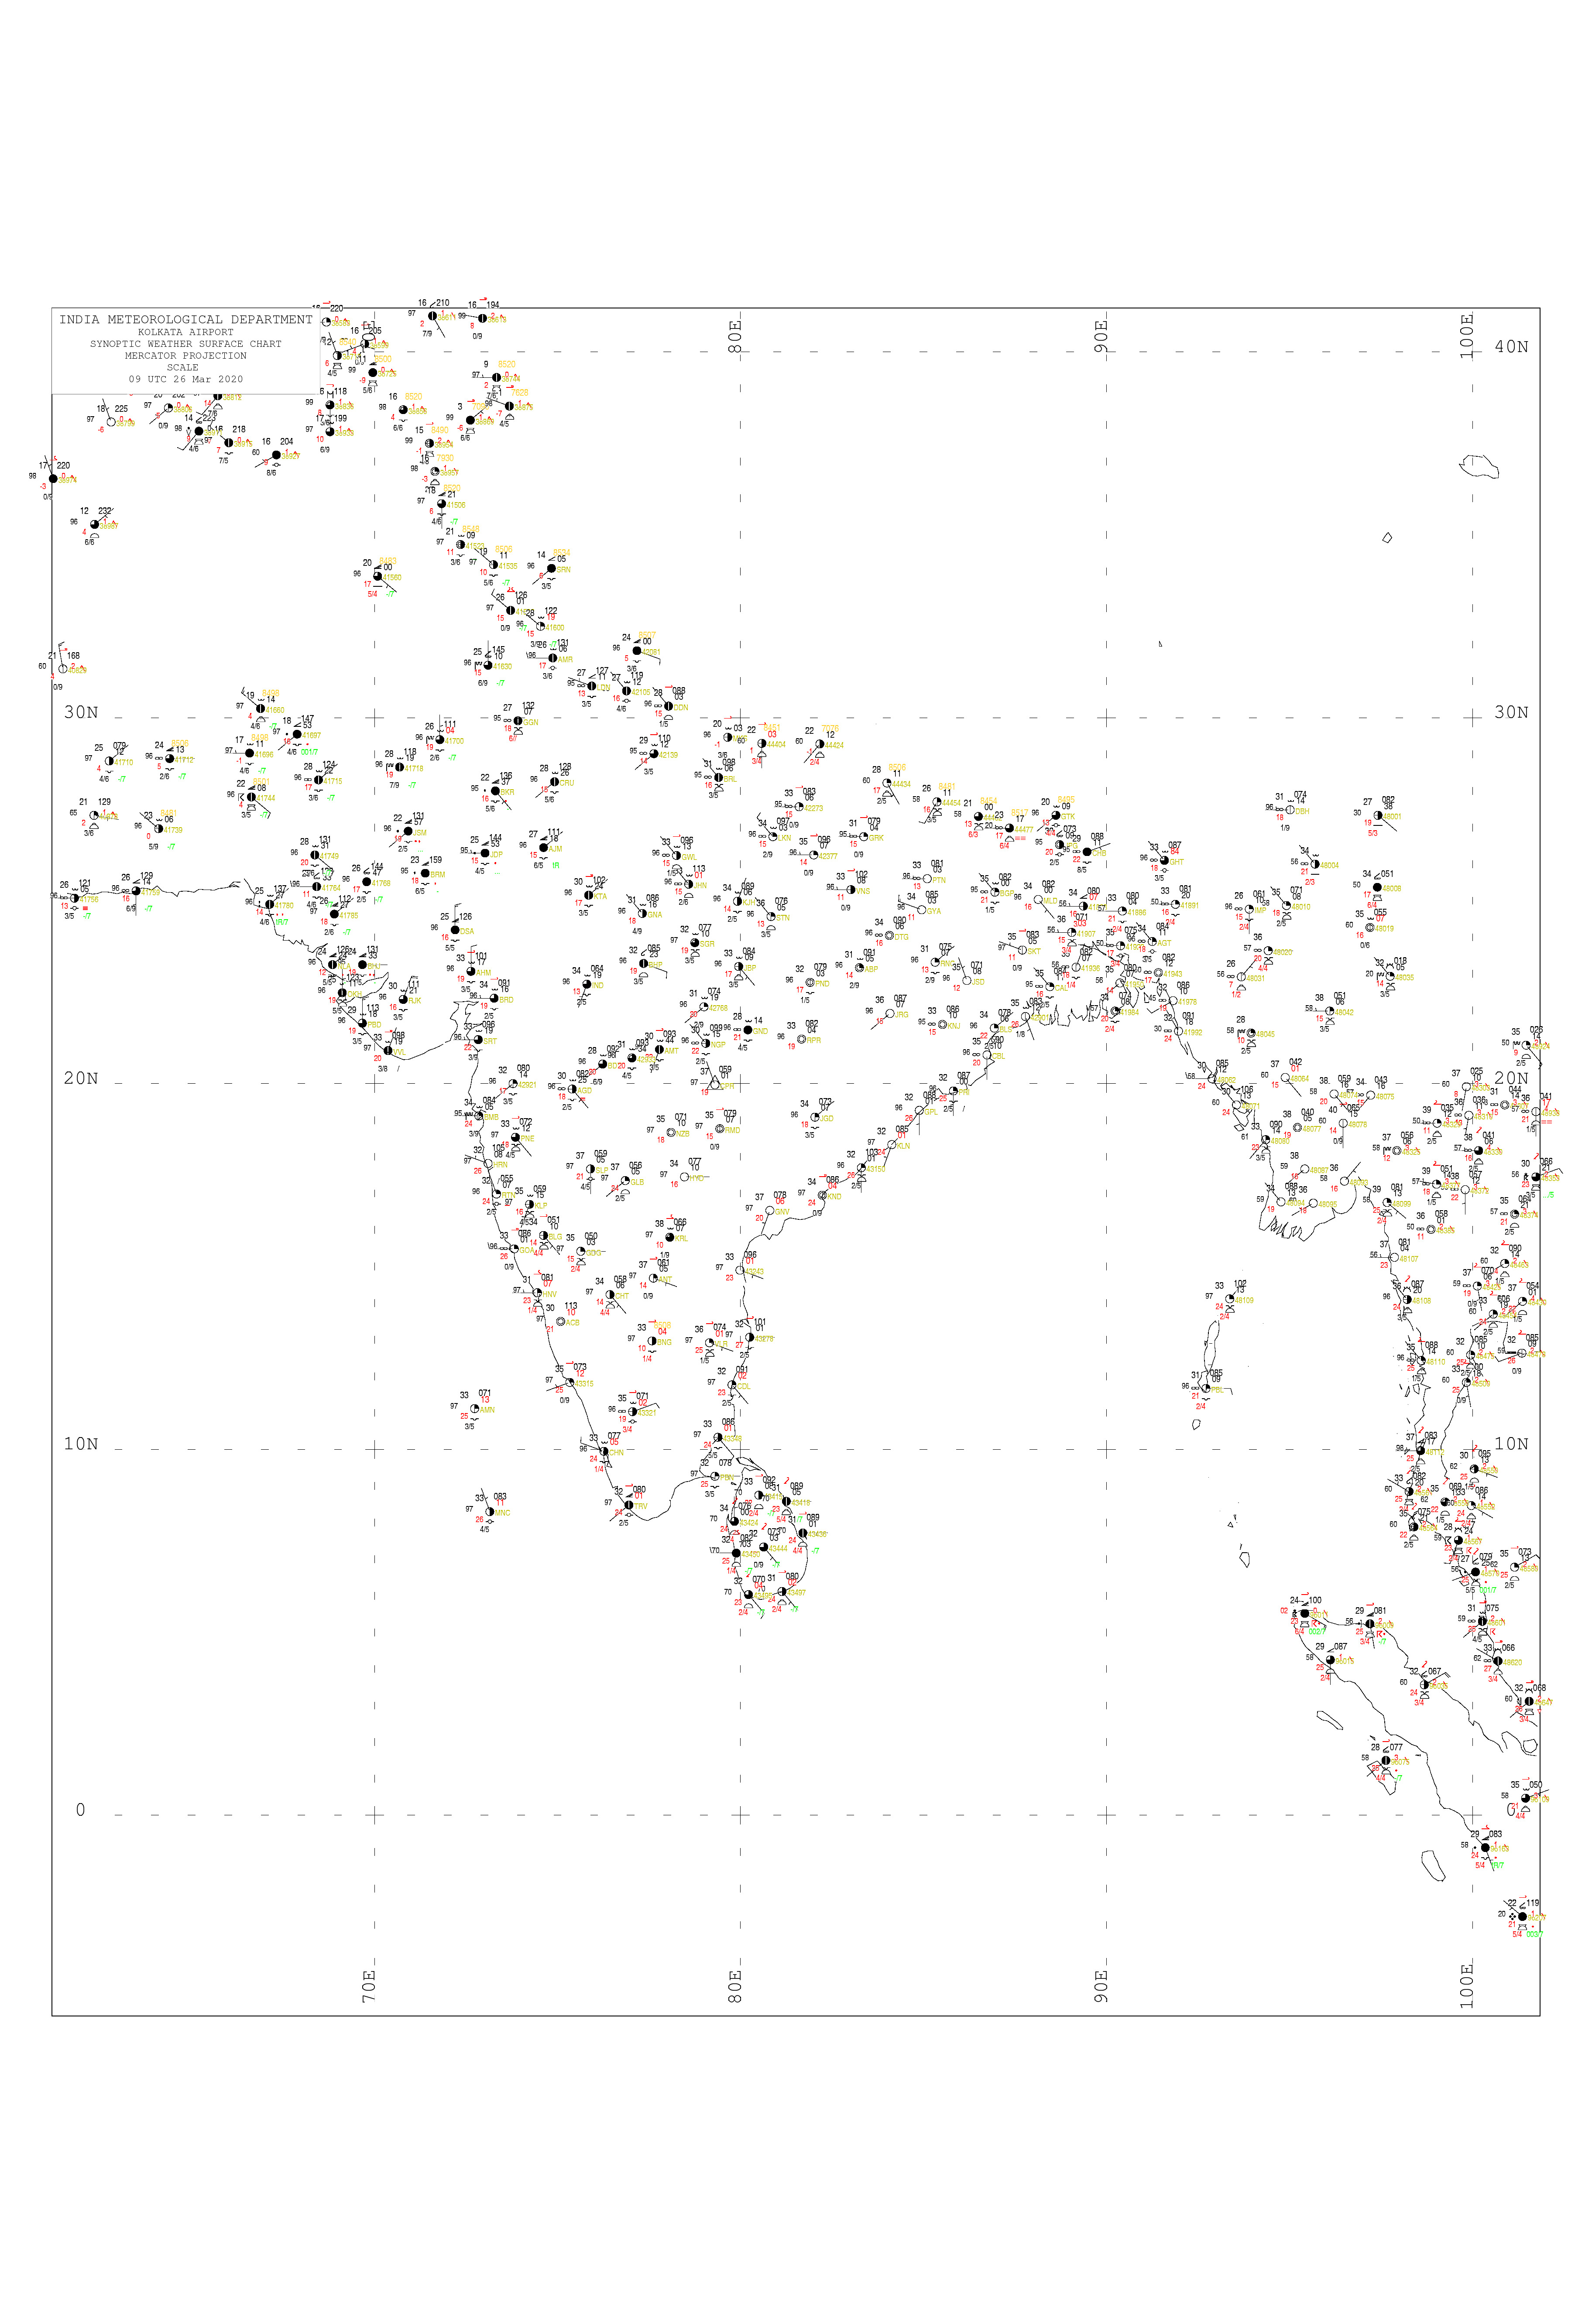
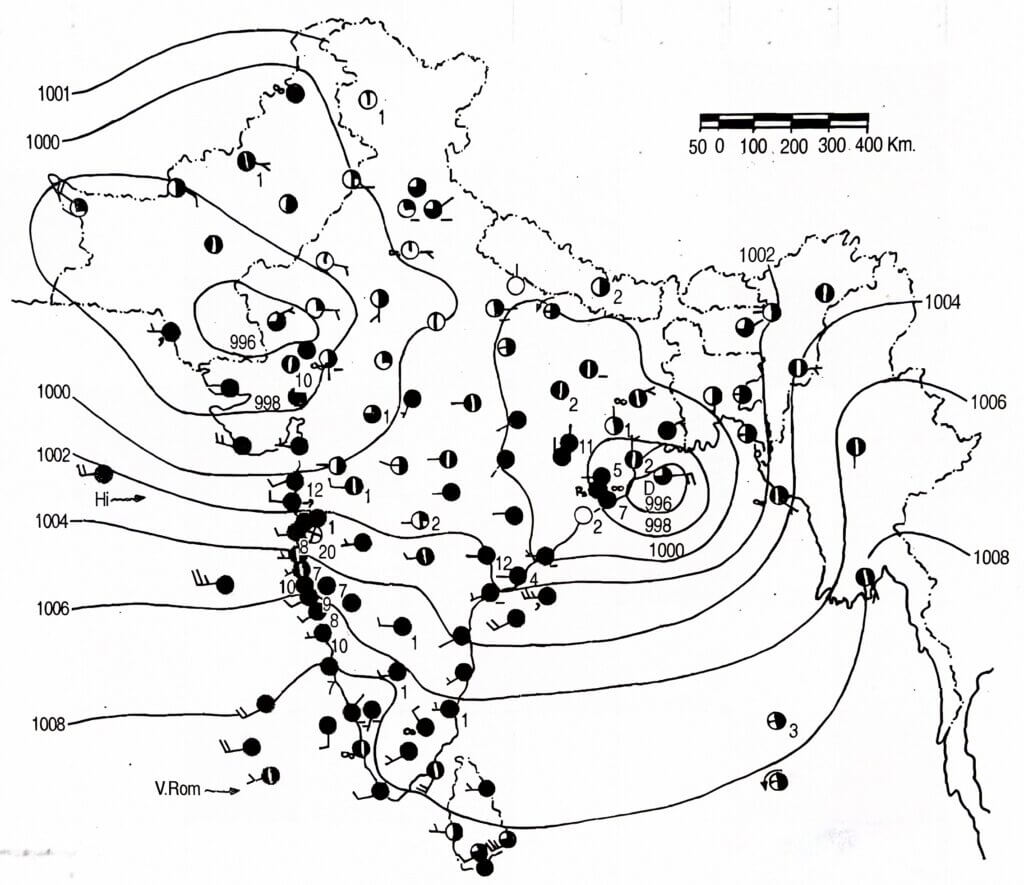
The Indian daily weather map is a political map of India, which also includes Pakistan, Afghanistan, part of China, Nepal, Bhutan, Myanmar and Sri Lanka with weather symbols indicating recorded weather data, isobars and keys for symbols.
Interpretation of weather maps
The given weather map in Figure 1 shows the condition of various elements of weather over the Indian sub-continent. This weather map may be interpreted under the following sub-titles:
- Pressure condition
- Extent and range of isobars
- Location of bar-low
- Location of bar-high
- Gradient pressure
- Wind condition
- Prevalent direction of wind
- Maximum and minimum velocity of wind
- Special features of wind system
- Co-relation between pressure and wind condition
- Distribution of cloud cover
- Occurrence of rainfall and its distribution
- Co-relation between cloud cover and rainfall occurrence
- Special weather phenomena and their significance
- Sea condition
- Departure of maximum and minimum temperature from normal and their significance
- correlation among various weather elements
- Identification of season
Example Interpretation
Pressure condition

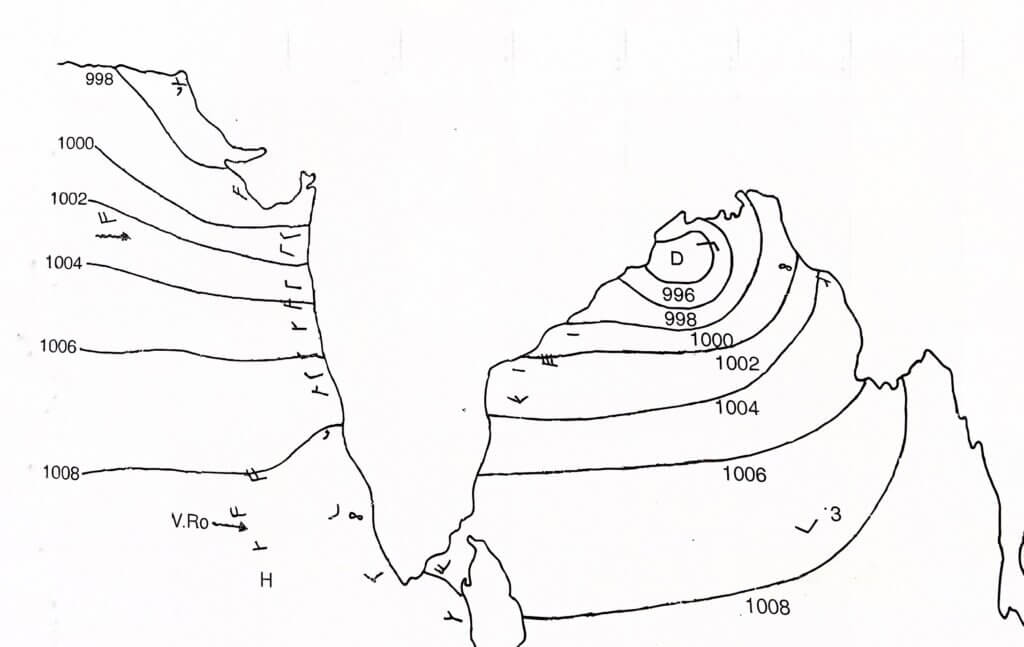
a) Extent and range of isobars: In the given weather map the isobars range from 996 mb. to 1008 mb. (Figure 2). The lowest value is observed at enclosed isobars over the northern part of the Bay of Bengal and in the western part of Rajasthan surrounding Barmer, whereas, the highest value is observed over the southern part of the Arabian Sea, Kerala, northern part the of Indian Ocean and over the Andaman Sea.
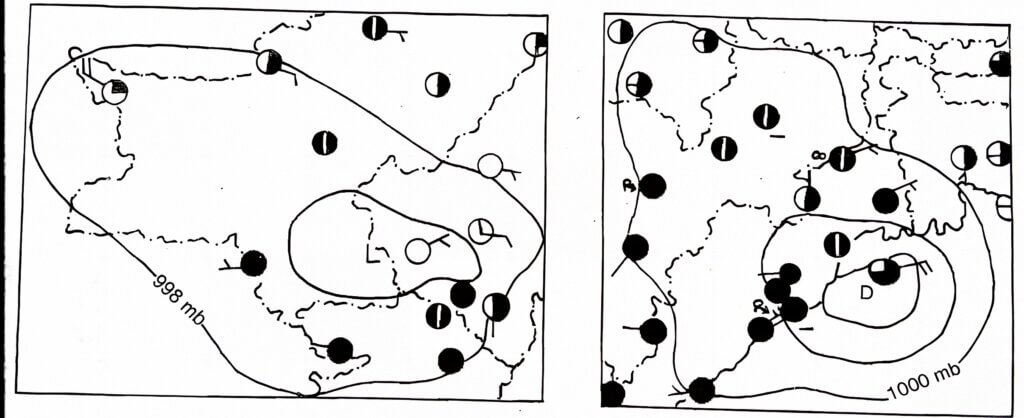
b) Location of bar low: Two low-pressure zones (Figure 3) have been recognised over the area by enclosing isobars, one over western Rajasthan and Pakistan and the other over the northern part of the Bay of Bengal off Orissa coast. The low-pressure zone over the bay has formed a depression with two other enclosing isobars extending the influence up to the eastern part of Uttar Pradesh. The western low-pressure zone is less strong, though well recognised.
c) Location of bar high: The northern part of the Indian Ocean has shown a high-pressure zone delineated by 1008 mb. isobar.
This reveals the fact that there was a high over the ocean and a low over the sub-continent on the day when the weather- observations were made.
d) Gradient of pressure: In general, the pressure gradient is gentler over the southern part of the Arabian Sea and over the Andaman Sea in the south of 1006 mb. isobar.
In the north of it, the gradient is steeper and the maximum steepness is observed in the southern periphery of the depression over the Bay of Bengal.
Wind condition
a) Prevalent direction of the wind: From the streamlines it is observed that the prevalent direction is from west and southwest (Figure 4).
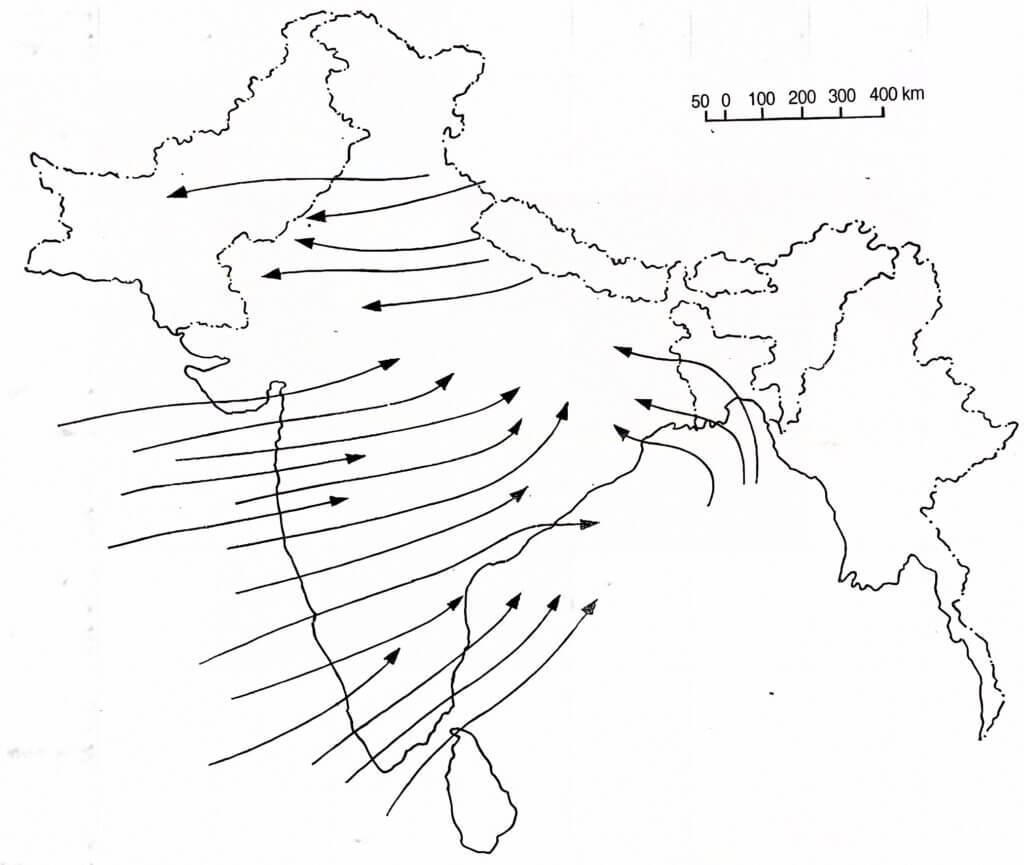
b) Maximum and minimum velocity of wind: It is observed for the winds from a westerly direction. The minimum velocity (5 knots) is observed in the winds from southeast and northeast. This attaches relatively more importance to the westerly winds over the other winds from other directions.
c) Special feature of wind system: Over north India, central India, north-eastern India and the north-western part of the sub-continent winds are not very strong and have a light breeze character. On the contrary, towards the southern part of the peninsula and also In the middle part, as well as over the northern part of the Bay and over the Arabian Sea, winds are stronger and have a strong breeze character.
Correlation between pressure and wind
In general, higher velocity of winds has been observed in the areas with steeper gradients of pressure.
In the surroundings of the two low-pressure zones, one forming a depression, winds have shown a whirling character. Obviously, these are anti-clockwise in direction.
Distribution of cloud cover

On the day of observations, almost the entire southern half of the sub-continent had cloud cover of considerable amount. In most of the areas the sky was overcast with clouds. Some other areas adjacent to them were having low clouds covering 25% to 75% of the sky.
Over Jammu and Kashmir, northern and western part of Uttar Pradesh, over part of Rajasthan there were very insignificant cover of cloud. Along the Konkon coast and over the coast of Orissa (Figure 5), a continuum of overcast was specially observed.
Occurrence of rainfall
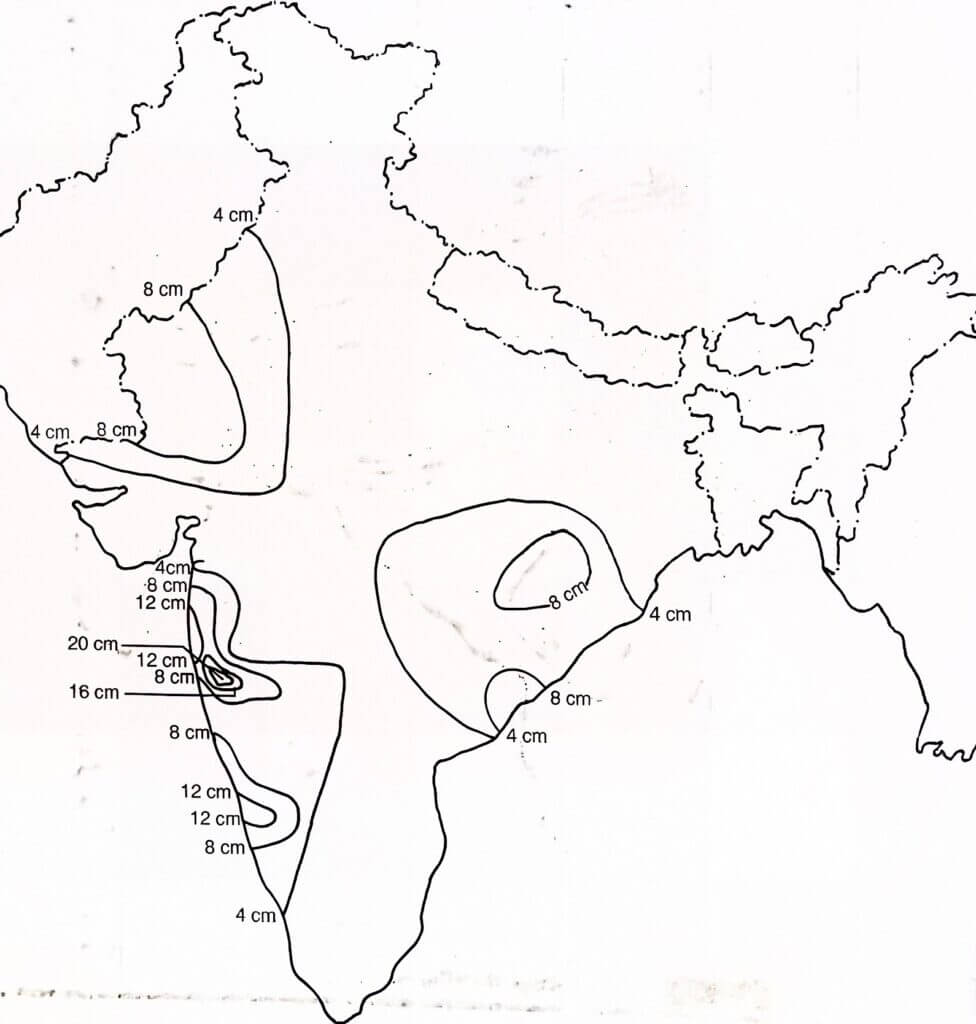
Rainfall was fairly wide-spread over the peninsula, though it was sporadic over north India. An isohyet map (Figure 6) has been prepared to show the distribution of rainfall. The map shows concentration of rainfall along the Konkan coast and in the surroundings of the eastern depression. The occurrence of rainfall was also noted over Port Blair (3 cm.).
The highest amount of rainfall received was 20 cm. in Ratnagiri area, whereas, the lowest was below 1 cm. (less than 0.75 cm.) over north India.
Correlation between cloud cover and rainfall occurrence
As mentioned earlier the Konkan coast has a dense cloud cover along with another counter part over the Orissa coast.
Consequently, these two areas have shown the greatest concentration of rainfall. The areas with low cloud cover did not receive any rainfall in general, except for a few sporadic occurrences.
Special weather phenomena and their significance
We have noted the occurrence of a thunderstorm over the coast of Orissa in the northwest of Kataka. This thunderstorm is perhaps linked to the depression formed over the area. The area has also experienced sufficient rainfall. Furthermore, we have particularly noted the occurrence of haze over Agra, Ahmedabad, Tiruchirapally, Cochin, and one or two other areas. This occurrence of haze may be related to industrial pollution in those areas.
Sea condition
On the day the Arabian sea was fairly turbulent and very rough conditions were noted. The Bay, on the other hand, did not show any such roughness, although wind velocity was sufficiently high (Figure 7).
Departure of Max. & Min. Temp. from normal & their Significance
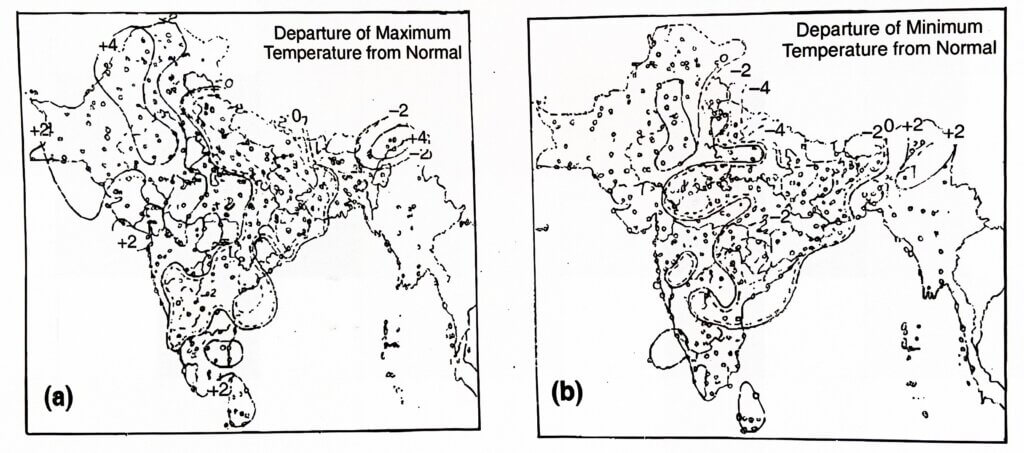
The temperature phenomena in terms of its departure from normal have shown that there were positive departure over the eastern part of India and over Rajasthan and Gujarat. This positive departure from normal may be linked to the formation of low-pressure zones. For the minimum temperature, a positive departure was also noted over north-western India. Over the Malabar coast, the positive departure of both minimum and maximum temperatures may be linked to the loops in the isobars (Figure 8(a, b)).
Correlation among various weather elements
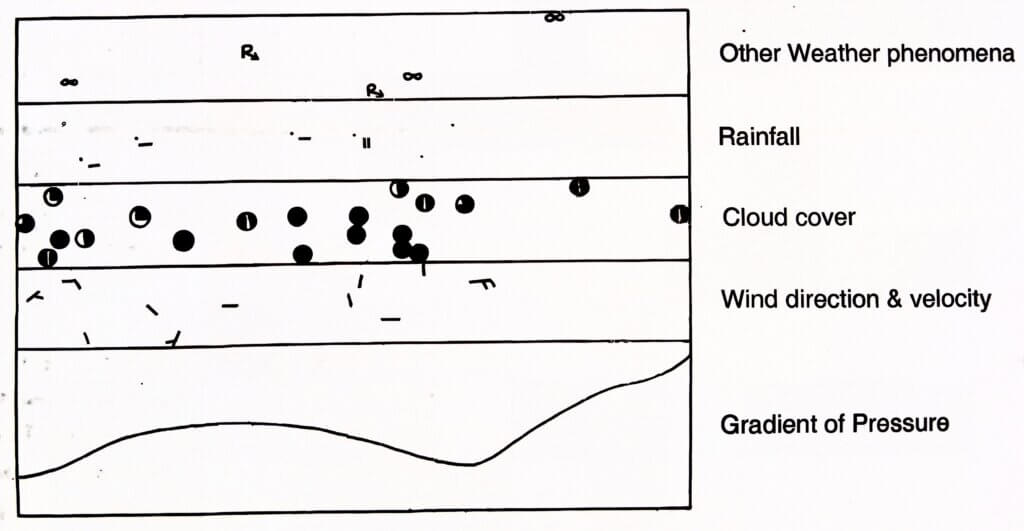
A transect chart showing vertical correlation among various weather elements with pressure gradient at the base shows that the low-pressure area has a higher velocity of wind and maximum concentration of clouds. A thunderstorm is also centred over there with another developed over a slightly higher pressure area.
Rainfall occurrence is also associated with areas of greater cloud cover (Figure 9)
Identification of season
The general prevalence of the south-westerly winds, the location of low pressure over the land and high over the ocean, the occurrence of rainfall over peninsular India, particularly along the Konkan coast, as associated with the overcast condition, and low cover of clouds over north India indicate that the observations occurred during the early part of the summer monsoon period.