
What are geological maps?
Geological maps are graphical representations of the distribution of geological features and formations on the Earth’s surface or below it. These maps provide valuable information about the geology of a specific region, showing various rock types, geological structures, mineral deposits, and other relevant geological data.
A geological map is arguably the most important tool a geologist uses to understand the Earth. Geological maps are used to convey information about where measurements were recorded in the field, to show the ages, distribution and orientation of rocks, and to locate important geological features like faults. While geological maps only show what is exposed on the surface of the Earth, they are used as a tool to help geologists interpret the geology of the subsurface.
Geologists use geological maps as a tool to answer a number of questions, such as:
- Where can we find a particular geological feature, like a notable shale bed rich in dinosaur fossils or the contact between two rock layers of interest?
- What is the geological history of this area, and how has it changed throughout geologic time?
- Are there potential geologic hazards like volcanoes, sinkholes, areas prone to landslides, or faults in this area? How can this information be conveyed to the public?
- Where can we find mineral deposits or energy resources, and how can we safely extract them?
- How can we better understand and visualise the geology below the Earth’s surface?
- Resource Exploration: Geological maps help identify potential areas for mineral and energy resource exploration, assisting in economic development and resource management.
- Environmental Assessment: Understanding the geology of an area is crucial for environmental impact assessments and land-use planning.
- Engineering Projects: Engineers use geological maps to plan infrastructure projects, such as roads, bridges, and tunnels, taking into account potential geological hazards.
- Education and Research: Geological maps serve as important educational tools and aid in conducting geological research and studies.
Key components of geological maps include:
- Rock Units: Different types of rocks are represented using specific colours or patterns. This helps to visualise the distribution and extent of various rock formations in an area.
- Geological Structures: Faults, folds, and other structural features are typically indicated on the map. These structures are crucial as they can affect the distribution of resources, such as minerals, and impact engineering projects, such as construction and infrastructure development.
- Topographic Information: Geological maps are often combined with topographic maps, which show the elevation and relief of the land surface. Topography influences the shape and form of geological features.
- Mineral Resources: The locations of important mineral deposits, such as coal, oil, gas, metals, and other valuable resources, are often marked on geological maps.
- Geological Symbols and Legends: A legend accompanies the map, explaining the various symbols, colours, and patterns used to represent different geological features.
- Scale and Orientation: Geological maps include scale bars to indicate distances and north arrows to show the orientation of the map.
Topographic, bathymetric, and geological maps
Topographic, bathymetric, and geologic maps are three distinct types of maps, each serving different purposes. Let’s briefly explain each one:
- Topographic Maps: Topographic maps represent the physical features of the Earth’s surface, including the natural and human-made features such as mountains, valleys, rivers, lakes, roads, and settlements. These maps use contour lines to show elevation and depict the shape of the terrain.
- Bathymetric Maps: Bathymetric maps, also known as bathymetry maps, focus on the topography of the seafloor or underwater terrain. Instead of showing the elevation of the land, bathymetric maps use contour lines to represent water depth, underwater canyons, ridges, and other submarine features.
- Geologic Maps: Geologic maps display the distribution of geological features and formations on the Earth’s surface and may also include subsurface information. These maps show different rock types, geological structures, fault lines, and other geological characteristics. Geologic maps are valuable for understanding the Earth’s geological history, identifying mineral resources, and assessing geological hazards.
There may be instances where these types of maps are combined, creating a map with multiple layers of information. For example:
- A topographic geologic map would show the physical features of the land surface alongside the distribution of geological formations and rock types.
- A bathymetric geologic map would combine underwater topography with information about the geological features beneath the seafloor.
Such integrated maps are particularly useful for studying regions where the land and seafloor interact or in areas with geological significance both on the surface and beneath the water. The combination of topographic, bathymetric, and geologic information can provide a comprehensive understanding of the Earth’s surface and subsurface features, making these maps valuable tools for various scientific, environmental, and resource-related studies.
The Intersection of Geology and Topography
Geological maps are often drawn as an overlay on top of a topographic base map to be easily linked to local geographic landmarks. They, therefore, display many of the same cartographic features as topographic maps, including contour lines, map scale, north arrow, and a legend.
The map patterns on a geological map and the geology we can observe on the Earth’s surface are influenced by topography. Imagine a geological map in an area where strata are horizontal and where the topography is completely flat. How would the geological map of this area look? Now imagine the same geology (strata are horizontal) but in an area with rugged, mountainous topography. How would the geological map of this area look? These questions may seem abstract now, but with practice, you will be able to picture how the map pattern on a geological map varies with topography and the attitude of the strata.
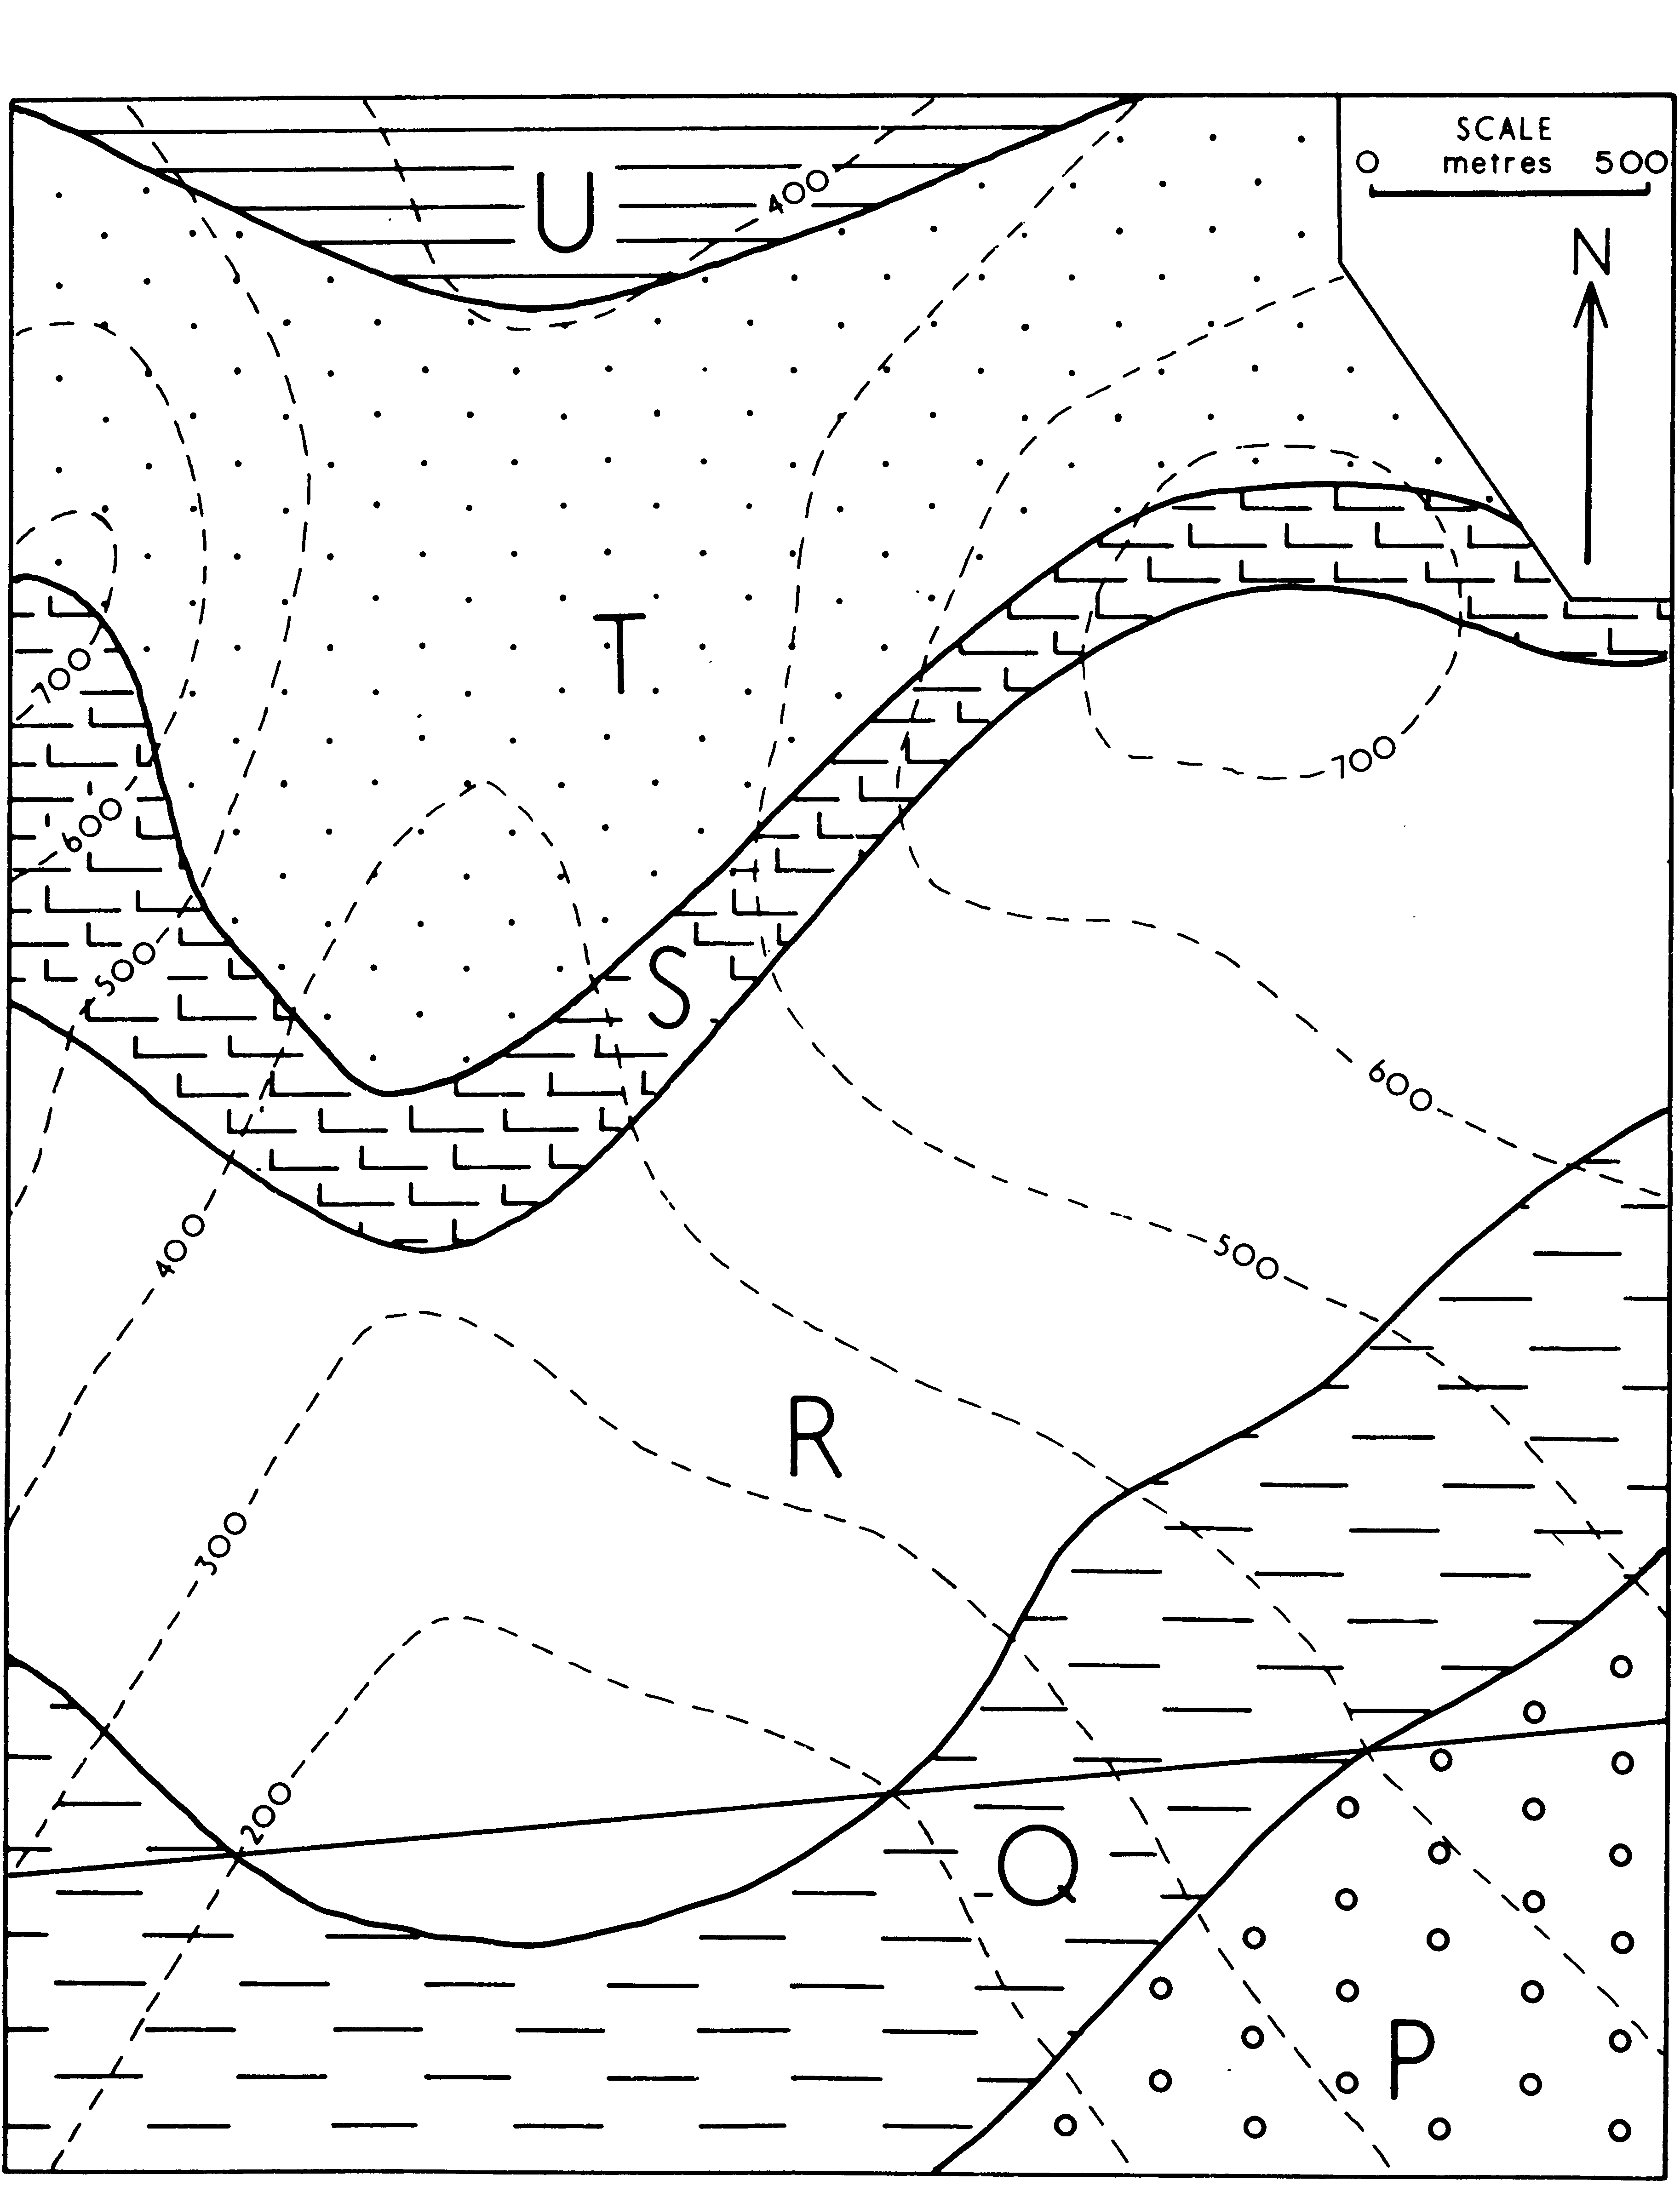
For example, examine the three panels of Figure 1. Each panel shows the plan view and the corresponding block model for three areas with different topography. Notice that the geology, meaning the strata and their attitude, is the same in all three panels. All three show four distinct horizontal layers, with 0° of dip. The map patterns differ dramatically, even though the actual orientation of the rocks has not changed. Figure 1 highlights how geological maps show the interaction between geology and topography.

It is important to remember that geology also affects topography. The nature of the topography in an area is strongly influenced by the relative strength of the geologic materials at and below the surface. For example, steep cliffs tend to form in relatively strong rocks that are resistant to weathering, whereas depressions might indicate the presence of a fault or that the area is underlain by rocks that are more susceptible to weathering. In this way, topography can provide clues (although not definitive answers!) about the nature of bedrock geology.
Types of Geological Maps
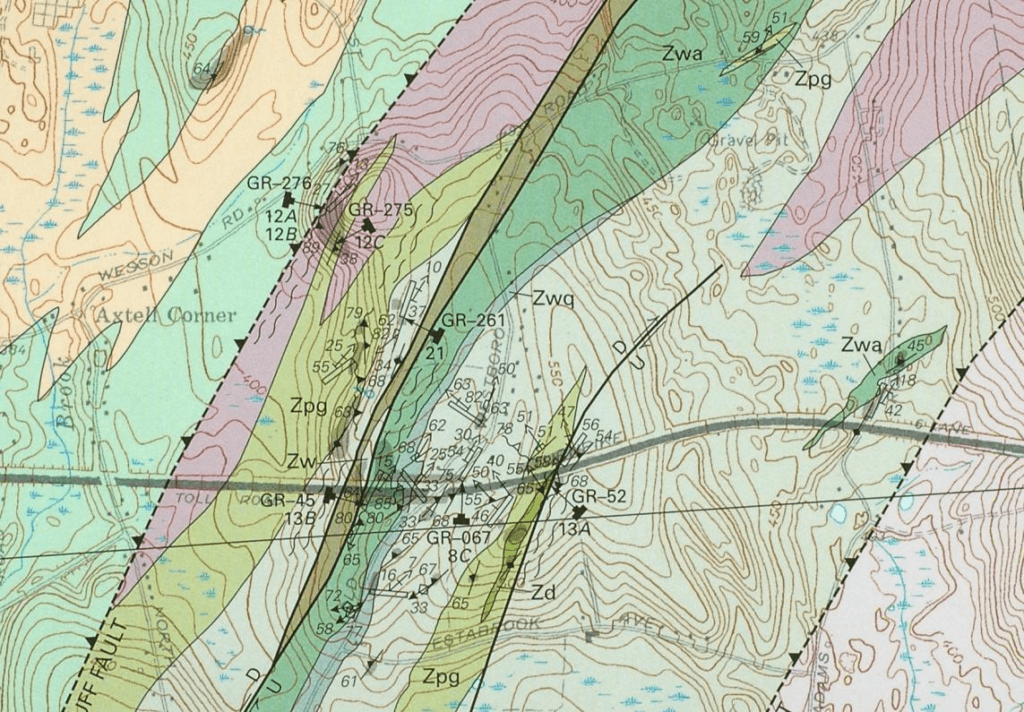
There are two primary types of geologic maps. The first type, known as a bedrock geologic map, displays the various rock units comprising the solid bedrock beneath the Earth’s surface. This is the type of map most commonly associated with geology. Bedrock geologic maps categorise the land surface based on the underlying rock type or rock formations, including their ages, along with relevant data points (Figure 2). Occasionally, these maps indicate areas where loose land surface deposits or surficial deposits cover the bedrock, but they typically do not classify surficial deposits in a way that reveals their age or origin.

The second type of geologic map is a surficial geologic map (Fig. 1.3). This type focuses on classifying the different geologic materials found on the land surface, with associated data, particularly emphasising surficial deposits and areas where bedrock is exposed but not classified. Surficial deposits are typically formed relatively recently in geological history and may include materials deposited by modern or recent streams, mass movement (e.g., landslides), coastal and marine processes (e.g., beaches and marshes), and glaciation. Surficial geologic maps generally do not attempt to classify different bedrock types or units. Instead, they primarily indicate where the bedrock surface is exposed at the land surface.
Bedrock and surficial geologic maps serve distinct purposes, leading to different ways of presenting geologic data. When searching for oil or ore deposits, a bedrock geologic map becomes invaluable, as it illustrates rock formations and bedrock structures that can aid in locating petroleum reservoirs or valuable mineral deposits. On the other hand, if you need to define floodplain boundaries, a surficial geologic map is more appropriate. It shows the differentiation between modern stream deposits and older, higher deposits from past stream levels, helping to delineate flood-prone areas.
For professionals like construction engineers or hydrologists interested in water resources, a combination of both types of maps proves useful. By referring to both bedrock and surficial geologic maps, they can determine the thicknesses and types of surficial deposits and understand the underlying bedrock’s nature. This information is crucial when designing foundations, managing water resources, or remediating pollution, as the structure and drainage characteristics of the underlying geology significantly influence the properties of the geologic materials involved in these processes.
Reading a geologic map
What symbols and features are included on geologic maps?
Below are some of the important data and interpretations to look for on a map.
Please carefully read through this page and review the materials linked in the text. You will need to be able to interpret these features on the geologic maps that follow.
Distance scale
All geological maps include a scale
Latitude and Longitude
Geologic maps also have latitude and longitude marked along the edges of a map, as a way to help locate positions on the map. This is much easier to do when you have a paper map in front of you, so we may locate points of interest differently (with geographic names or points marked on the map) for these exercises.
Topographic Contour Lines
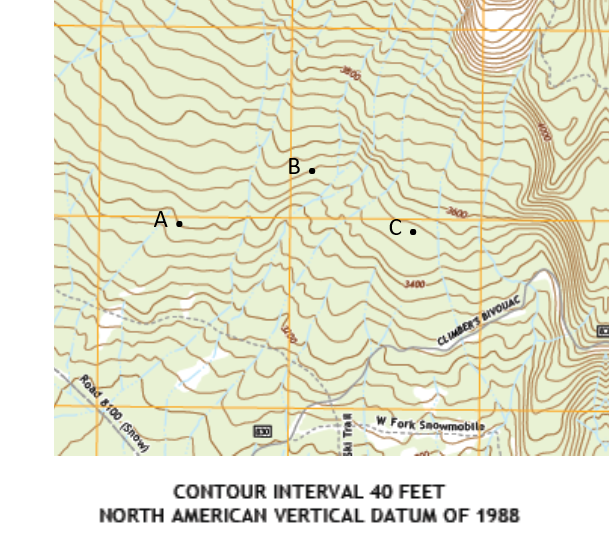
Some geologic maps include contour lines: the topographic map is essentially superimposed on top of the geologic map. For clarity, other geologic maps omit the topography so the geologic features are more easily viewed.
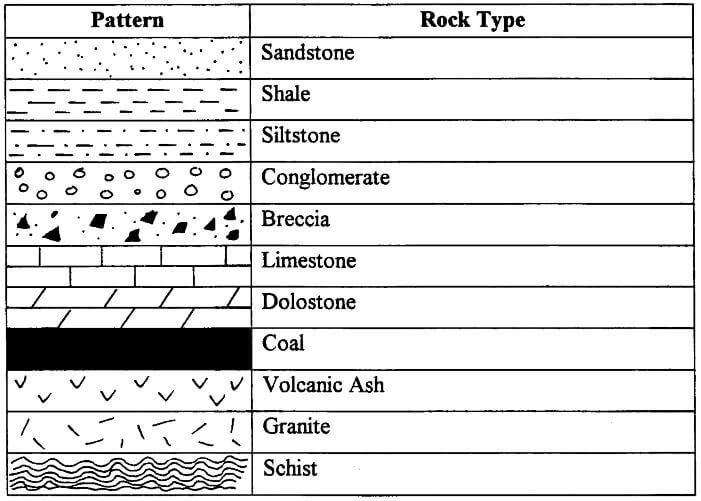
Geologic map symbols for common rock lithologies
Geological maps use standardised symbols to represent common rock lithologies. These symbols help geologists identify and differentiate various rock types on the map. Here are some common geological map symbols for different rock lithologies.
Geologic structure symbols
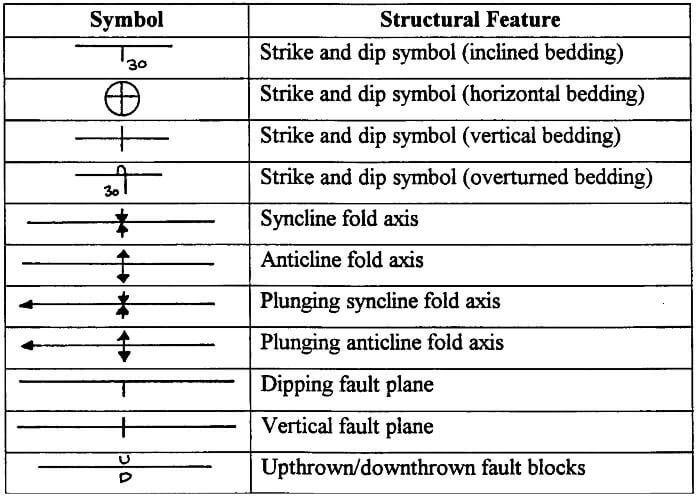
Geological maps use various symbols to represent geological structures, which provide valuable information about the deformation and tectonic history of an area. Here are some common geological map symbols for different geological structures:
- Strike and Dip: The strike and dip of rock layers are fundamental structural measurements. The symbols for these are represented as follows:
- Strike: A short line with an arrow indicating the direction of the horizontal line formed by the intersection of the rock layer with a horizontal plane.
- Dip: A short line crossing the strike line at a specific angle, indicating the inclination or dip direction of the rock layer from the horizontal plane.
- Anticline: An anticline represents an upward-arching fold in the rock layers. It is typically depicted as a series of nested or concentric curved lines, with the limbs of the fold sloping away from the centre.
- Syncline: A syncline is a downward-arching fold in the rock layers. It is often represented as a series of nested or concentric curved lines, with the limbs of the fold sloping towards the centre.
- Monocline: A monocline is a gentle bend or flexure in otherwise horizontal rock layers. It is depicted as a series of straight lines with a slight bend in one direction.
- Fault: Faults are fractures in the Earth’s crust along which movement has occurred. Different types of faults have specific symbols:
- Normal Fault: Represented by a line with a series of downward-facing arrows, indicating the hanging wall has moved down relative to the footwall.
- Reverse Fault: Represented by a line with a series of upward-facing arrows, indicating the hanging wall has moved up relative to the footwall.
- Strike-Slip Fault: Represented by a line with vertical hash marks, indicating horizontal movement along the fault plane.
- Joint: Joints are fractures in rocks without significant movement along the plane. They are depicted as simple straight lines crossing the rock layers.
- Unconformity: Unconformities represent gaps in the geologic record due to erosion or non-deposition. They are often shown as wavy lines.
- Foliation and Cleavage: Foliation and cleavage represent planar structures in rocks caused by metamorphism. They are usually depicted as a series of closely spaced parallel lines.
These are some of the common geological map symbols used to represent geological structures. Proper interpretation of these symbols is crucial for understanding the geology and tectonic history of a region.
Beds and bedding planes
In geology, “beds” and “bedding planes” are fundamental concepts used to describe the arrangement and layering of rock units in sedimentary rocks.
Beds

A bed refers to an individual layer or stratum of sedimentary rock that is relatively distinct and separate from adjacent layers. Each bed represents a specific episode of sediment deposition, where sediments accumulate over time in a particular environment (e.g., rivers, lakes, oceans) and eventually solidify into rock. Beds can vary in thickness, ranging from thin layers (millimetres) to thicker ones (meters), depending on the sedimentary environment and the duration of deposition.
Bedding planes
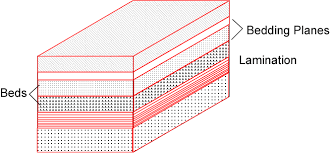
A bedding plane, also known as a stratification plane, is a flat, horizontal surface that separates one bed of sedimentary rock from another. In other words, it is the boundary between two adjacent beds. Bedding planes are formed during the process of sediment deposition and represent periods of rest or non-deposition, where sedimentation temporarily stops. When new sediment accumulates on top of an existing bed, it eventually becomes compacted and solidifies into rock, forming a new bed, and the process repeats.
To visualise this relationship, imagine a stack of sedimentary layers (beds) one on top of the other. Each layer represents a separate bed. The boundary between any two adjacent layers is a bedding plane.
The study of bedding planes is crucial in understanding the stratigraphy of sedimentary rocks. The orientation and characteristics of bedding planes provide valuable information about the depositional history, geological processes, and environmental conditions during the formation of sedimentary rock sequences. Geologists use this information to interpret the geological history of an area, reconstruct ancient environments, and unravel the complex processes that shaped the Earth’s surface over time.
Lamination
Lamination refers to the presence of fine layers or thin beds within a single larger bed. These thin layers, known as laminae, are typically parallel to the bedding plane and represent variations in sedimentary characteristics or environmental conditions during the deposition of the bed. Lamination occurs when sediment is deposited in a relatively calm and consistent manner over time, allowing for the formation of distinct, closely spaced layers. Each lamina may consist of different sediment types, grain sizes, or mineral compositions. These variations can result from changes in the energy of the depositional environment, fluctuations in sediment supply, or periodic shifts in environmental conditions.
Rock outcrops
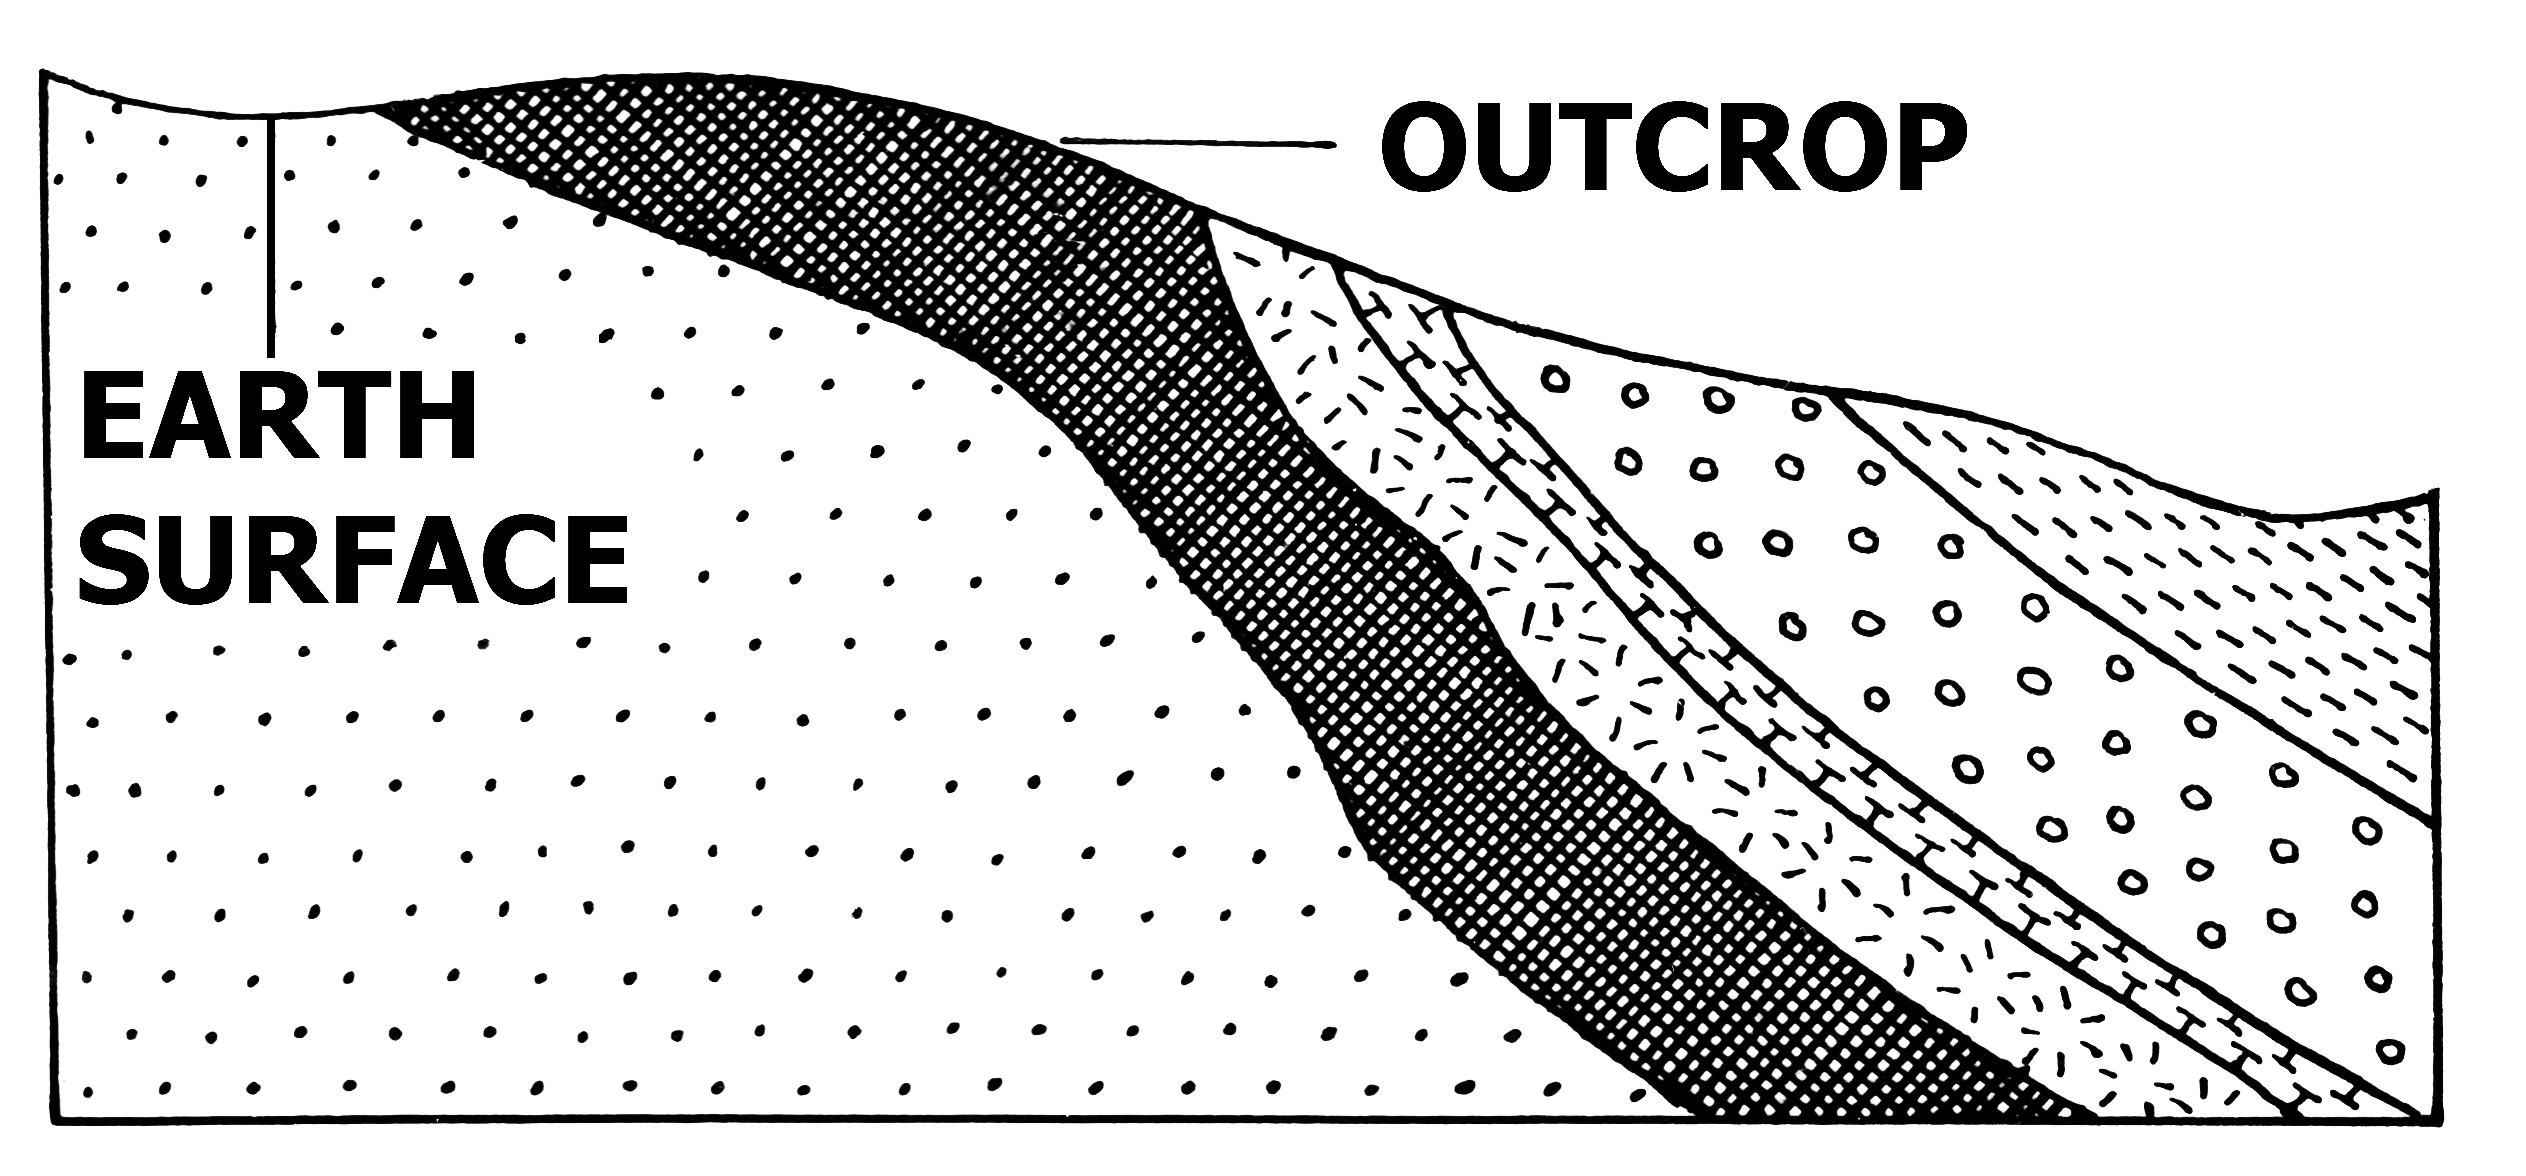
Rock outcrops are exposed sections of bedrock or geological formations that are visible at the Earth’s surface. They occur when layers of rock are exposed due to erosion, weathering, or human activities, revealing the underlying geology. Outcrops can be found in various natural settings, such as cliffs, canyons, riverbanks, hillsides, and mountain slopes.

The term “outcrop” is commonly used in geology to describe places where geologists can directly observe and study the rock formations without the need for excavation or drilling. Outcrops are essential for understanding the geological characteristics, structures, and history of an area. By examining the exposed rock layers, geologists can gain insights into the types of rocks present, their composition, age, and the geological processes that have shaped the landscape over time.
Strike and dip

In geology, “strike” and “dip” are terms used to describe the orientation and inclination of rock layers or geological structures. They are essential measurements used to understand the geological features present in a given area.
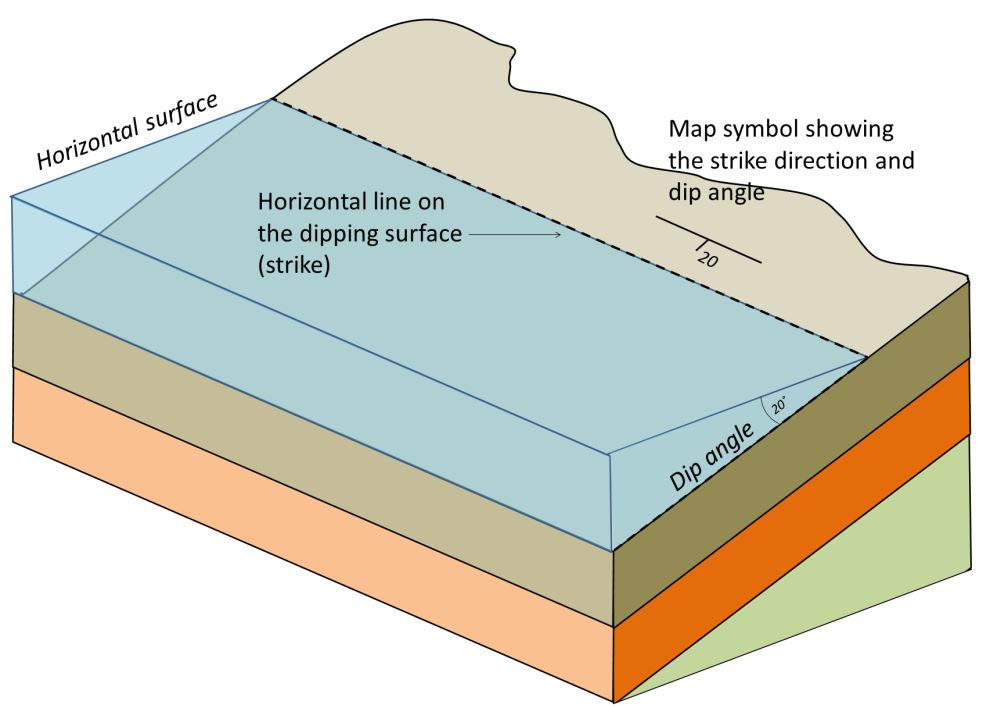
Strike
The “strike” refers to the direction of a horizontal line formed by the intersection of a rock layer, fault, or other geological structure with a horizontal plane. In simpler terms, it is the compass direction in which a rock layer or structure is oriented on the Earth’s surface. The strike is always measured relative to north, and it is typically represented in degrees (e.g., N30°E, S45°W).
To determine the strike, a geologist would lay a flat surface, such as a compass, on the exposed rock layer or structure, aligning it parallel to the horizontal plane. Then, they would read the compass direction to determine the strike.
Dip
The “dip” represents the angle of inclination or the slope of a rock layer or geological structure from the horizontal plane. It indicates how steeply the rock layer or structure is tilting or dipping into the Earth’s subsurface. The dip is always measured perpendicular to the strike.
The dip angle is measured in degrees from the horizontal plane. If a rock layer is horizontal (parallel to the Earth’s surface), the dip is 0°. If it is vertical (perpendicular to the Earth’s surface), the dip is 90°. Dip angles can range from 0° to 90°, depending on the degree of inclination.
A useful way to think about strike and dip is to look at the roof of a house (Figure). A house’s roof has a ridge along the top, and then sides that slope away from the ridge. The ridge is like a strike line, and the angle that the roof tilts is the dip of the roof.
(Source: Joyce M. McBeth (2018))
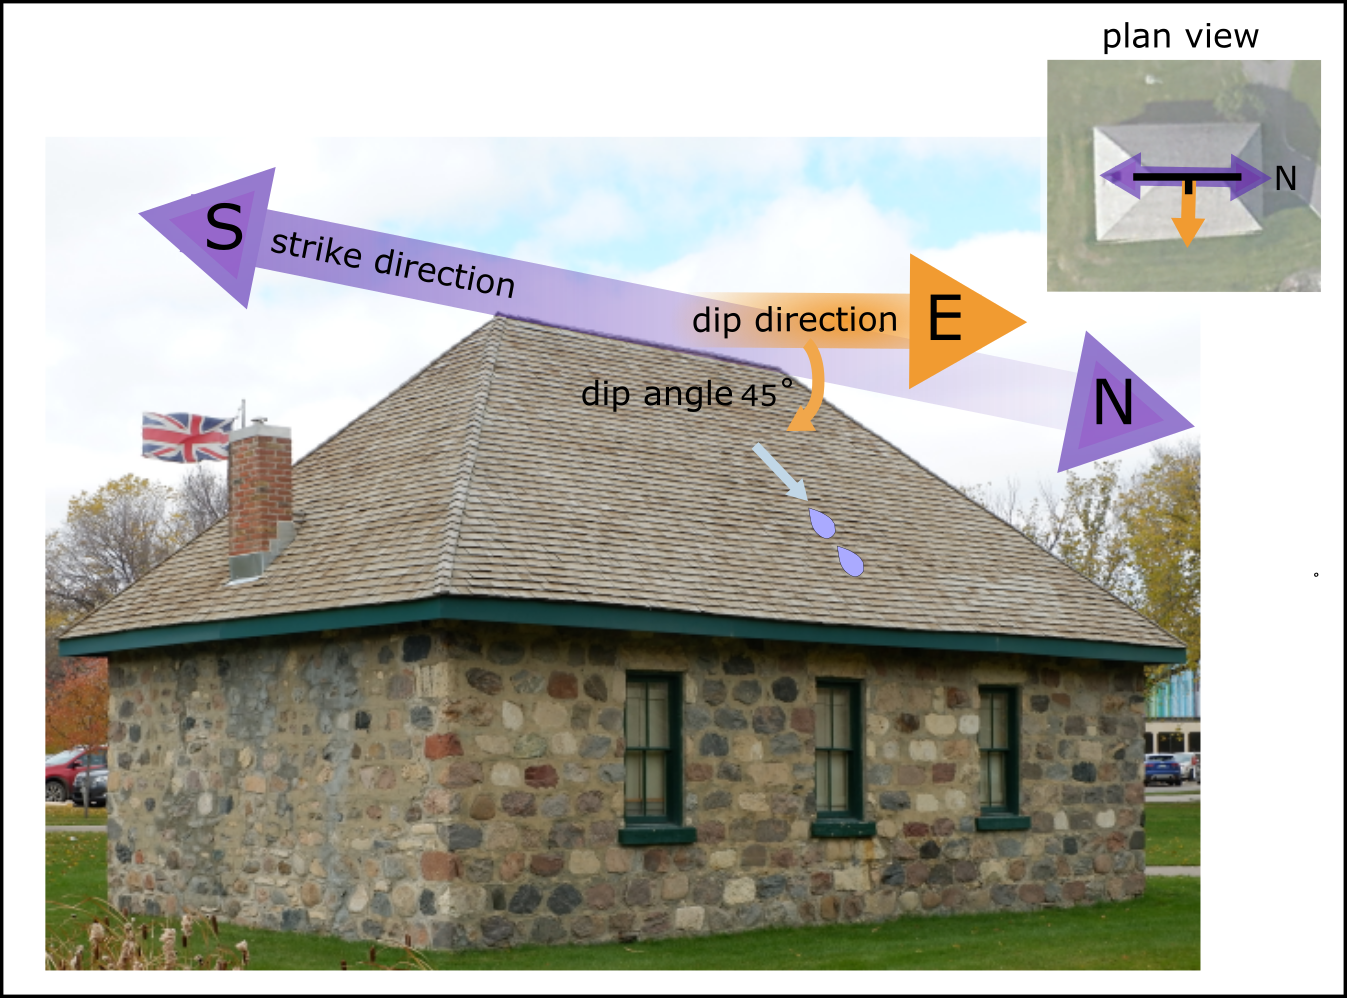
Strike and dip for tilted sedimentary beds. Water provides a horizontal surface. The strike and dip symbol is a T with the long horizontal bar representing the strike direction, and the small tick mark indicating the dip direction. The dip angle is written next to the tick mark.
Source: Karla Panchuk (2018) CC BY 4.0. Modified after Steven Earle (2015) CC BY 4.0
On a map, geologists use a strike and dip symbol to represent inclined beds.
Strike and dip map symbols look like the capital letter T, with a short trunk and extra-wide top line. The short trunk represents the dip, and the top line represents the strike. Dip is the angle that a bed or layer plunges into the Earth from the horizontal. A number next to the symbol represents the dip angle.
Source: Strike and dip on a map. Protractor modified from: Autiwa – Own work, CC BY-SA 3.0.
Rules of strike and dip

- Strike is always parallel to the bedding direction at that location.
- The dip is always drawn perpendicular to strike in map view. It may be drawn at an angle to show perspective in a 3D block diagram.
- The dip CAN be labelled with the dip angle, or only the direction can be indicated. The dip always shows which way layers are tilting into the Earth.
- Special symbols are used for horizontal beds and vertical beds. A horizontal rock bed has a dip of 0°, and a vertical rock bed has a dip of 90°
Tilted bed examples
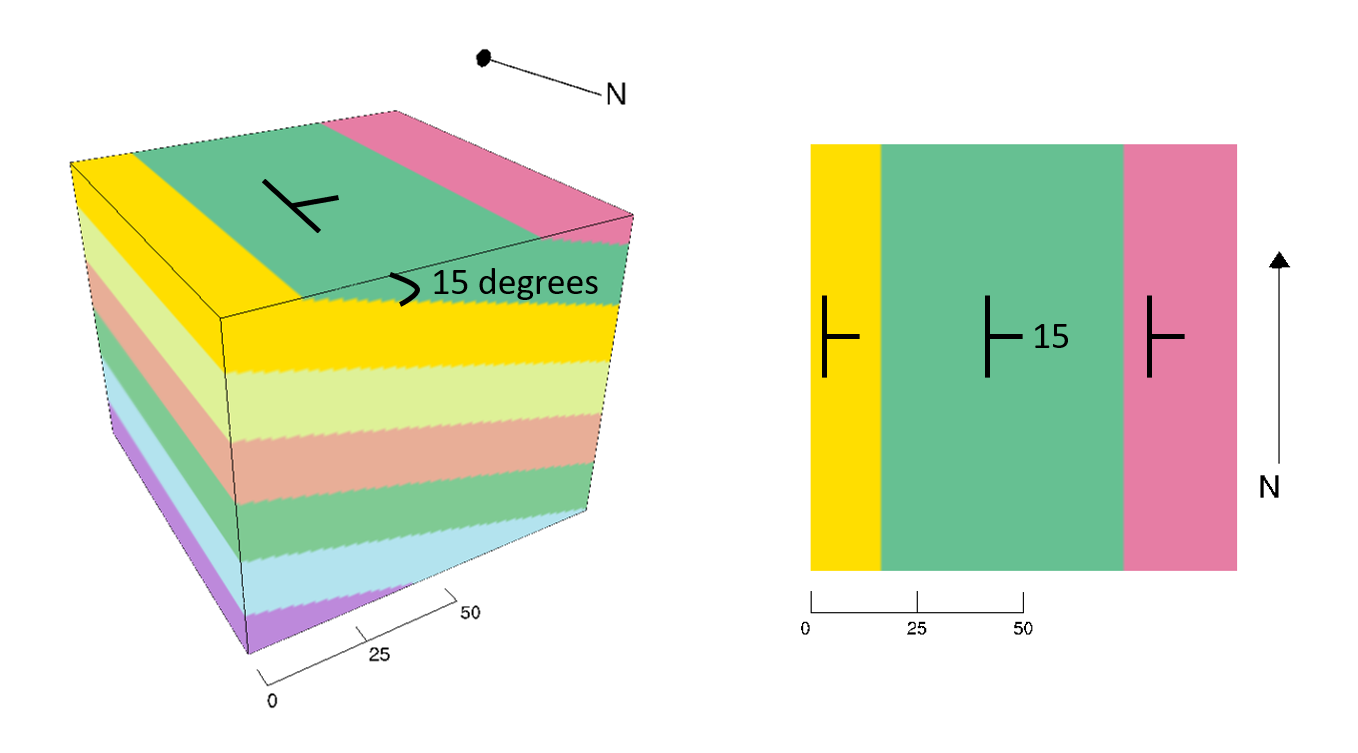
Tilted beds- 15 degrees
3D interactive model of the above Figure: http://app.visiblegeology.com/model.html#ahFzfnZpc2libGUtZ2VvbG9neXIPCxIFTW9kZWwYqcLLnAEM )
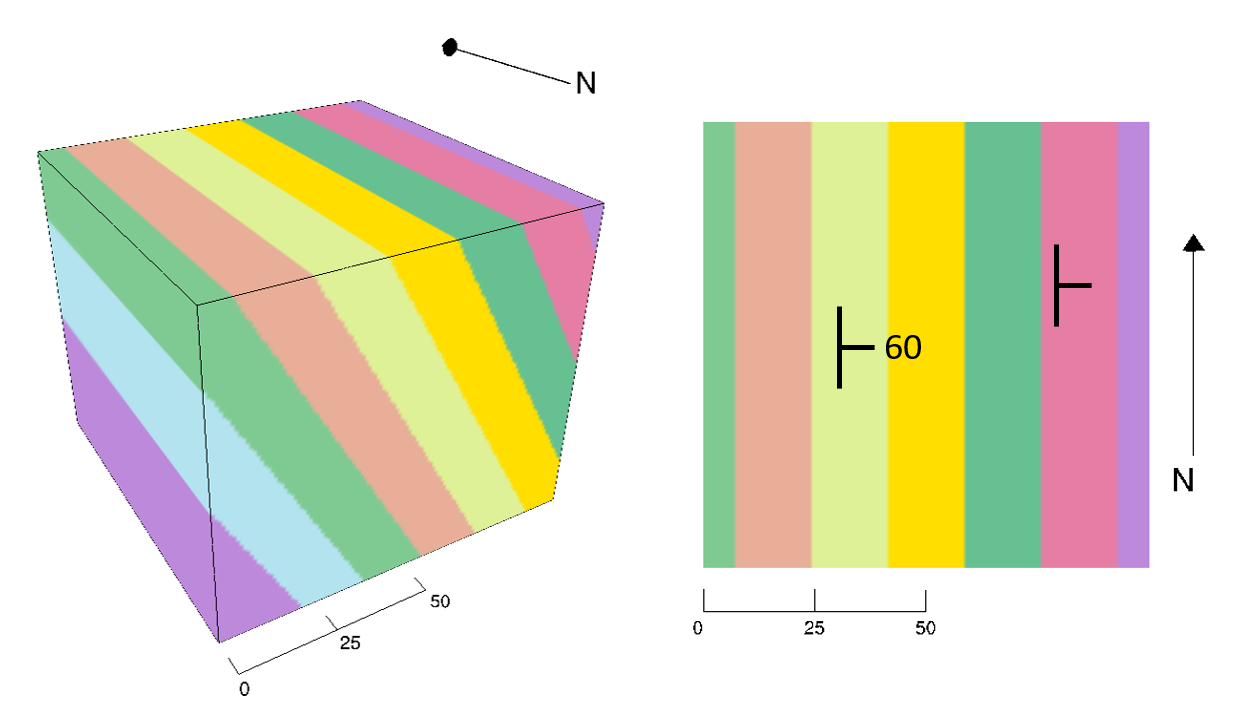
Tilted beds – 60 degrees.
3D interactive model of the above Figure: http://app.visiblegeology.com/model.html#ahFzfnZpc2libGUtZ2VvbG9neXIPCxIFTW9kZWwYyeKJpAEM
