What is a Digital Image?
A digital image is a numerical representation of a two-dimensional visual scene. It consists of a grid of pixels, where each pixel holds a value representing a specific property of the scene, such as brightness or colour. In remote sensing, sensors typically capture digital images in various spectral bands, including visible, infrared, and microwave, allowing for multi-dimensional data analysis.
Raw data collected by satellite sensors often require significant processing to extract meaningful insights. This is where digital image processing comes into play. It involves manipulating and analysing digital images to enhance their quality, extract features, and interpret information.
Pixel Structure

The structure of a digital image can be visualized as a grid of rows and columns. Each cell in the grid represents a pixel, which is the smallest unit of the image. The value of each pixel corresponds to a specific attribute, such as intensity or colour. For example, in grayscale images, the pixel values range from 0 (black) to 255 (white). The image provided illustrates this concept, showing rows, columns, and a highlighted pixel to represent the grid structure.
Analogue and Digital Images
Images can broadly be classified into two types: analogue and digital.
- Analogue Images: These are continuous-tone images, like photographs or X-ray films, which represent visual information in a non-discrete form. The intensity values in an analogue image are continuous, making them highly dependent on the medium used for storage or display.
- Digital Images: These are numerical representations of visual information, captured as a finite set of discrete values (pixels). Each pixel in a digital image is assigned a specific intensity or colour value, allowing for efficient storage, processing, and analysis. Unlike analogue images, digital images can be easily manipulated using computer algorithms, making them ideal for applications in remote sensing.
Differences between Analogue and Digital Images:
| Aspect | Analog Images | Digital Images |
|---|---|---|
| Representation | Continuous | Discrete (pixels) |
| Processing | Difficult | Easy with computer algorithms |
| Storage | Requires physical media | Stored as numerical data on computers |
| Applications | Traditional photography, film-based | Remote sensing, medical imaging, etc. |
Multilayer Image
A multilayer image is formed by stacking multiple types of data, where each layer represents a specific measurement or piece of information about the same geographic area. These measurements could come from different sensors or sources, such as satellite imagery, radar data, or elevation maps. By combining these different layers, a more comprehensive view of the area is created.
For instance, a multilayer image might consist of layers from a Landsat multispectral image (including blue, green, and near-infrared bands), a layer from a WorldView high-resolution panchromatic image, and a layer representing a thermal infrared image to capture temperature variations across the area. Each layer captures unique spectral or spatial information, and when combined, they provide a detailed representation of the area’s surface, such as vegetation health, urban infrastructure, and temperature distribution.

Multispectral, Superspectral, and Hyperspectral Images
While a multilayer image is a general concept, it often aligns with multispectral, superspectral, and hyperspectral imaging, which differ in the number and type of bands included:
| Type | Number of Bands | Description | Examples |
|---|---|---|---|
| Multispectral | 3–10 | A limited number of discrete spectral bands capturing broader parts of the spectrum. | SPOT HRV (Green, Red, Near-IR), IKONOS (Blue, Green, Red, Near-IR) |
| Superspectral | 10–30 | More bands than multispectral, offering better spectral resolution for distinguishing between materials. | Advanced hyperspectral sensors (e.g., MODIS in specific modes) |
| Hyperspectral | 100+ (narrow, contiguous bands) | Very high spectral resolution; used to detect subtle differences in material composition. | AVIRIS (224 bands), Hyperion (220 bands) |
Each pixel in these images contains values for all the bands, allowing for a multi-dimensional view of the scene. For instance:
- A SPOT HRV multispectral image includes three bands: green (500–590 nm), red (610–680 nm), and near-infrared (790–890 nm). Each pixel has three intensity values corresponding to these bands.
- A Landsat TM image has seven bands: blue, green, red, near-infrared, two shortwave infrared (SWIR) bands, and a thermal infrared (TIR) band. This diversity supports applications like vegetation analysis, water quality assessment, and thermal studies.
Spatial Resolution


Spatial resolution is like the “zoom level” of a camera for the real world. It tells us how small of an object we can clearly see or distinguish on the ground in an image or map.
- In Digital Images: The smallest thing you can see is about the size of a single pixel. So, if a pixel is big, you can’t see small details well—this is low resolution. If a pixel is tiny, you can see very small details—this is high resolution.
- How It’s Determined: The basic ability to see small things comes from the sensor’s “Instantaneous Field of View” (IFOV), which is like the sensor’s “eye” and how much ground it can see at once. But, things like focus, weather, and moving targets can blur the image, making the effective resolution worse.
- High vs. Low Resolution:
- High Resolution: This means you can see tiny details. The pixels are small, so the image is clear and shows fine features.
- Low Resolution: This means you can only see big, broad features. The pixels are large, so the image is blurry and doesn’t show small details.

Spatial resolution is how much detail an image or map can capture, with higher resolution meaning you can see smaller, more detailed features on the ground.

This picture illustrates the concept of remote sensing raster (matrix) data format, specifically focusing on digital image terminology.
- Digital Image Terminology:
- Rows (i): Represented vertically, each row contains a set of values.
- Columns (j): Represented horizontally, each column contains a set of values.
- Bands (k): Represent different layers or channels of data; in this case, there are 4 bands.
- Matrix Representation:
- The image shows a 4×5 matrix for each band, where each cell in the matrix represents a pixel with a specific brightness value (BV). For example, the pixel at row 4, column 4, band 1 has a brightness value of 24 (indicated as BV4,4,1=24).
- Brightness Value Range:
- The brightness value range is shown to be from 0 to 255, typically for 8-bit grayscale images. This scale goes from black (0) to white (255).
- Associated Grayscale:
- There’s a grayscale bar on the right showing how the brightness values correspond to shades from black to white.
Spatial Resolution and Pixel Size
Spatial Resolution and Pixel Size are two closely related but distinct concepts.
Spatial resolution refers to the level of detail a remote sensing system or camera can capture about the Earth’s surface or an object, typically measured in meters or feet per pixel as the ground sample distance (GSD). Higher spatial resolution signifies the ability to discern finer details, while lower resolution results in a more generalized view of the scene.
On the other hand, pixel size, or pixel dimension, pertains to the physical dimensions of a single pixel within the sensor array of a camera or remote sensing device, usually expressed in micrometres. Smaller pixel sizes can theoretically enhance spatial resolution by capturing more light and detailing smaller areas on the ground. However, the actual spatial resolution is also influenced by other factors such as the sensor’s focal length and the platform’s altitude.

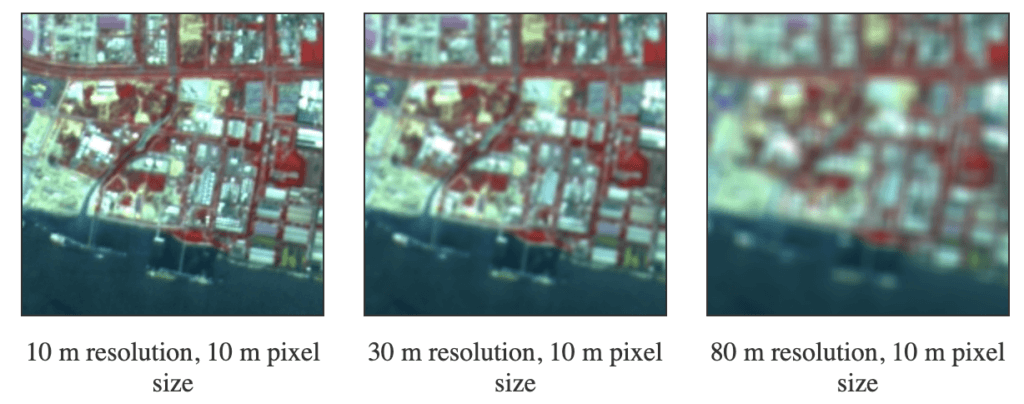
SPOT Image (10 m Pixel Size): This image is created by merging a SPOT panchromatic image (10 m resolution) with a SPOT multispectral image (20 m resolution). The merging process combines the high-resolution panchromatic data with the colour information from the lower-resolution multispectral data. As a result, the effective resolution of the merged image is limited by the panchromatic image’s resolution, which is 10 meters. Despite having a 10-meter pixel size, the image’s resolution is also 10 meters.
Blurred Version (10 m Pixel Size): The first image is then processed to degrade its resolution while keeping the pixel size unchanged at 10 meters. This creates a blurred version of the original image. Although this blurred image and the original share the same pixel size, their resolutions are different. The blurred image appears less detailed and has a lower effective resolution due to the applied blurring effect.
Further Blurred Version (10 m Pixel Size): A second, even more blurred version of the original image is created, maintaining the 10-meter pixel size. Like the first blurred image, it has the same pixel size as the original but a significantly lower resolution due to increased blurring.
Radiometric Resolution
Radiometric resolution is a measure of a sensor’s capability to detect and differentiate subtle variations in radiant energy. It is typically expressed in bits of quantization and directly impacts the image’s dynamic range, signal-to-noise ratio, and ability to capture detailed information. Higher radiometric resolution is beneficial for applications requiring precise analysis and interpretation of brightness and intensity variations in remote sensing data.
It is closely related to the number of quantization levels used to represent the continuous intensity values in a digital image.
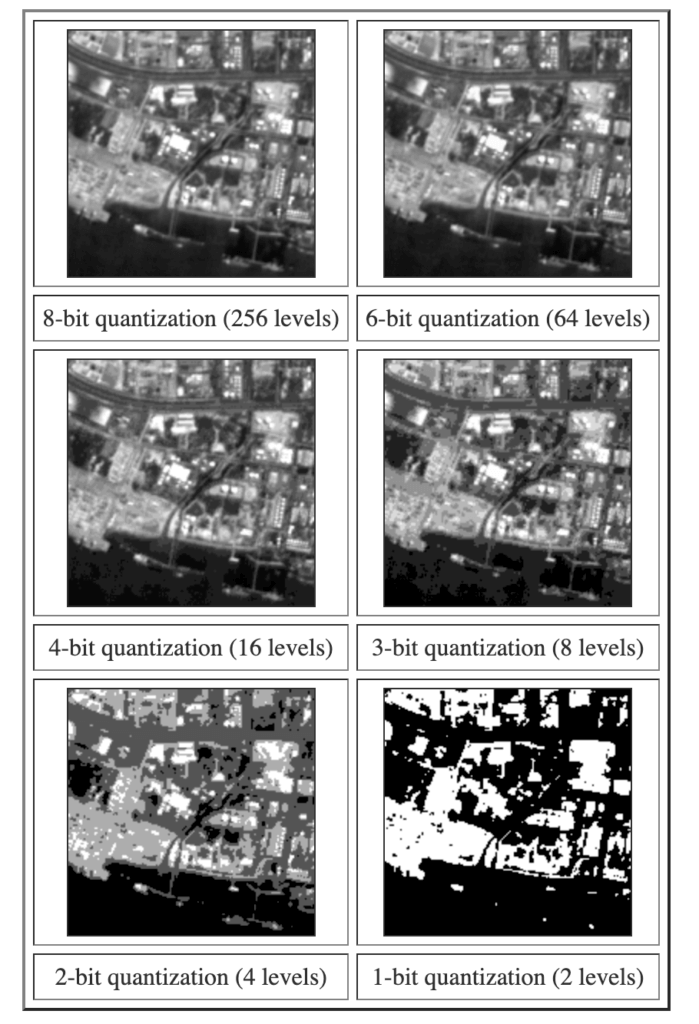
Quantization Levels: The number of quantization levels directly impacts the radiometric resolution. Each level represents a discrete step in the intensity scale.
Effect on Image Quality:
- Higher Bit Depth (More Levels): Enhances radiometric resolution by allowing for a finer gradation of intensities. This results in smoother transitions between brightness levels, higher image quality, and improved ability to detect subtle variations.
- Lower Bit Depth (Fewer Levels): Decreases radiometric resolution, leading to a coarser representation of intensities with visible staircasing effects (quantization noise) and reduced capability to distinguish subtle differences. This significantly degrades image quality.

- 8-bit Quantization: Offers 256 discrete intensity levels (ranging from 0 to 255), providing a reasonable level of detail but with visible noise and less smooth transitions.
- 6-bit Quantization: Reduces the intensity levels to 64, leading to a more noticeable loss of detail and increased quantization noise.
- 4-bit Quantization: Further decreases the levels to 16, significantly reducing detail and making fine features difficult to discern.
- 3-bit Quantization: Limits the levels to 8, resulting in a highly abstract image with very few discernible features.
- 2-bit Quantization: Provides only 4 intensity levels, creating a very blurry and abstract image with minimal detail.
- 1-bit Quantization: Uses just 2 levels (black and white), making it almost impossible to identify specific features or details.